Global growth has picked up some momentum to start the year. The J.P. Morgan Global Composite Purchasing Managers’ Index (PMI), a survey-based indicator that sheds light on business conditions in both the manufacturing and services sectors, came in at 51.8 in January, up from 51.0 in December and the highest reading since June 2023. A look beneath the surface, however, reveals a widening divergence in the growth patterns of major economies.
U.S. economic outperformance continues
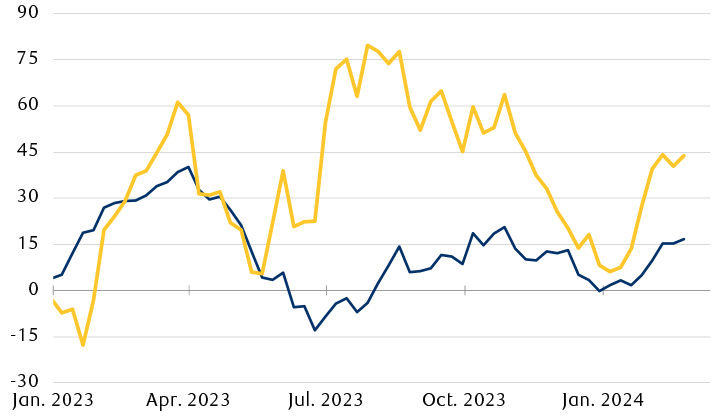
Line chart showing global and U.S. economic surprise indexes beginning in Jan. 2023. In 2023, global growth broadly surprised on the upside, with U.S. economic data consistently delivering stronger positive surprises. This dynamic of "U.S. exceptionalism" has so far carried into 2024.
Note: Surprise indexes measure how economic data compares with consensus expectations.
Source - RBC Wealth Management, Bloomberg; data through 2/23/23
U.S. exceptionalism
Persistent strength in the labour market has helped position the U.S. economy on a firmer base relative to peers. The U.S. has added nearly 1.5 million net new jobs over the past six months, with the unemployment rate near multi-decade lows at 3.7 percent and real (i.e., inflation-adjusted) wage gains finally making meaningful strides as inflation subsides. Another recent tailwind has come in the form of productivity growth—workers doing more per hour worked. Measured in output per hour, U.S. labour productivity rose at a 3.2 percent annualized rate in Q4 2023. This marked the third consecutive notable improvement in productivity, following increases of 4.9 percent and 3.6 percent in the previous two quarters.
These factors suggest consumer spending—a pillar of the U.S. economy, accounting for around 70 percent of GDP—is likely to remain a steady growth contributor in the near term. Projections from the Atlanta Fed’s GDPNow model suggest U.S. real GDP could expand by roughly three percent quarter-over-quarter in Q1 2024, in line with its three percent average growth rate in the second half of 2023 and meaningfully above consensus expectations of 0.1 percent for the eurozone, 0.5 percent for Canada and Japan, and 1.3 percent for China.
In our view, much of this divergence can be attributed to variations in global economies’ sensitivity to interest rates and global trade conditions. Compared with its economic peers, the U.S. is less sensitive to higher borrowing costs; the ratio of U.S. household debt to disposable income, at 97.3 percent, is near the lowest levels since the early 2000s, and the bulk of this household debt comprises mortgages locked into 30-year fixed rates under five percent. The U.S. is also more insulated against adverse developments in global trade, as exports make up only 11 percent of its economy.
Rate cuts can wait
As inflation has retreated in major economies, their central banks have begun to lay the groundwork for an eventual pivot to monetary easing. But both the magnitude and the timing of potential interest rate cuts remain highly uncertain. Much will depend, we believe, on the inflation and labour market data that policymakers monitor most closely: services prices and wage growth.
In the U.S., Federal Reserve policymakers have been pushing back against aggressive market expectations for rate cuts, expressing skepticism that conditions are in place for a sustainable return to two percent inflation. This, together with the recent string of stronger-than-expected economic and inflation data, have prompted markets to revise their interest rate expectations.
Interest rate expectations have been pushed back
Market-implied policy rate expectations
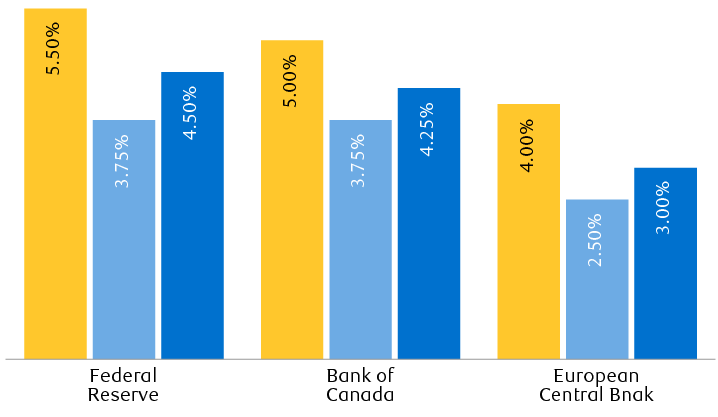
Bar chart showing how market pricing for central bank rate cuts has evolved since mid-January. In January, markets foresaw the Fed cutting rates to about 3.75% by the end of year, now markets see the Fed cutting to just 4.50%, compared to a current policy rate of 5.50%. Also in January, markets foresaw the BoE and ECB cutting rates to about 3.75% and 2.50%, respectively by the end of year, now markets see the BoE and ECB cutting to 4.25% and 3.00%, respectively, compared to a current policy rate of 5.00% and 4.00%, respectively.
Source - RBC Wealth Management, Bloomberg; data through 2/23/23
As recently as mid-January, futures pricing showed that markets expected the Fed to trim its policy rate to 3.75 percent from 5.50 percent by year’s end, via a series of seven cuts starting in March. Futures markets now anticipate the first Fed rate cut in June, and the benchmark rate ending the year around 4.50 percent. Over the past 30 years, the average time from the last Fed rate increase to the first cut has been 10 months; assuming the July 2023 rate hike was the last one for this cycle, May and June are both in play if this pattern holds. Considering the renewed strength in the labour market, we believe the risks are currently skewed towards fewer cuts and a later start to the easing cycle.
The evolving investment landscape
The world economy is navigating a landscape marked by an evolving mix of resilience and challenges. But according to current Bloomberg consensus expectations, 2024 should be a better year than 2023, with 7.5 percent earnings growth forecasted for the MSCI All Country World Index. An expanding economy should allow corporate profits to rise over the coming quarters and support equity markets—although we would note that the sharp rally since last October, and the attendant higher valuations, may have anticipated this sanguine outlook. In addition to earnings delivery, the potential for equities to generate above-average gains over the next 12 months also hinges, in our view, on whether elevated valuation multiples can be maintained or ascend further.
Do valuations have room to rise?
MSCI All Country World Index forward price-to-earnings ratio
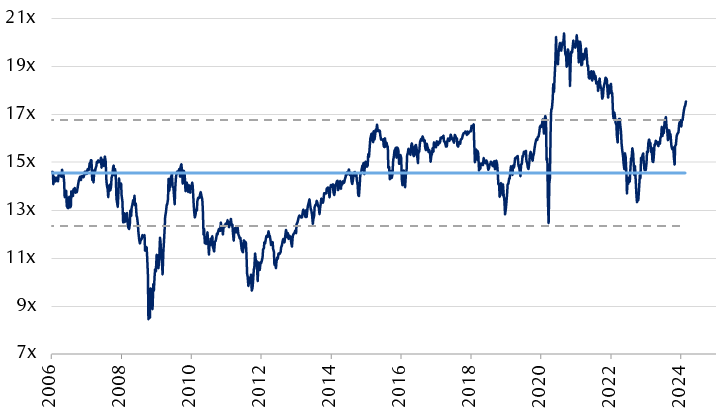
Line chart showing the forward price-to-earnings ratio for global equities, proxied by the MSCI All-Country World Index. The index is currently valued at 17.5x forward price-to-earnings, having risen from roughly 15x since October 2023, and is now more than one standard deviation above its long-term average of 14.6x.
Source - RBC Wealth Management, Bloomberg; data through 2/23/23
Meanwhile, we continue to see opportunities in fixed income markets. Entry points matter a great deal for bonds, because history has shown that starting yields are strongly correlated with subsequent returns. The broad uplift in yields year to date has moderately improved the risk-reward profile for many bond markets, in our view. While all-in yields remain at levels that may allow bonds to serve as an adequate source of returns in portfolios over the medium term (see chart below), we believe investors should consider a selective approach to corporate bond exposure in light of the mediocre compensation for taking credit risk.
Valuations across major asset classes
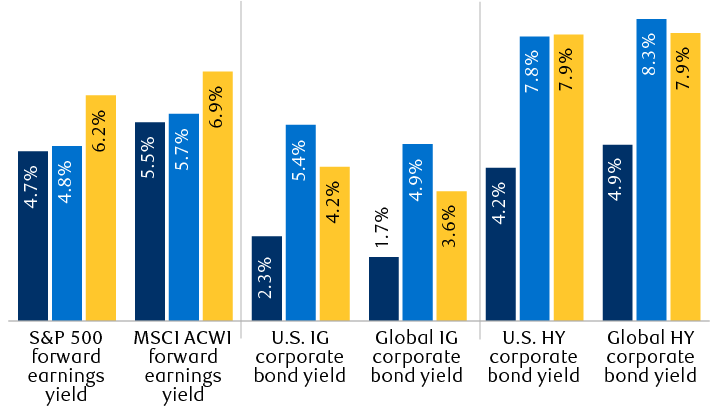
Column chart showing the current forward earnings yield for the MSCI All Country World Index and the S&P 500 and the yield to worst for the Bloomberg U.S. Corporate Index, the Bloomberg Global Agg Credit Index, the Bloomberg U.S. Corporate High Yield Index, and the Bloomberg Global Corporate High Yield Index, compared to January 1, 2022, and the average since 2002. On a relative basis, the yield advantage that equities commanded over corporate bonds has sharply diminished over the 25 months.
* Earnings yield is the inverse of the forward price-to-earnings ratio. Bond yield refers to yield to worst for the Bloomberg U.S. Corporate Index, the Bloomberg Global Agg Credit Index, the Bloomberg U.S. Corporate High Yield Index, and the Bloomberg Global Corporate High Yield Index. IG = investment-grade rated, HY = high-yield rated.
Source - RBC Wealth Management, Bloomberg; data through 2/23/23