The S&P 500 has delivered a nearly textbook performance so far during this Middle East crisis compared to average returns surrounding prior military interventions:
- The index experienced a 7.8 percent pullback from the onset of U.S. and Israeli strikes on Iran through March 30 compared to the 6.0 percent average decline.
- A quick V-shaped recovery then followed, bringing the index to a slightly higher level than it was before this conflict began.
- This journey took only 30 trading sessions, similar to the average of 28 sessions in 19 of the 20 prior episodes.
Then the S&P 500 climbed to a new all-time high on Wednesday on further optimism about the ceasefire and U.S.-Iranian negotiations, and the related decline in crude oil prices.
We think another important factor has pushed the market higher as well: Upward revisions to S&P 500 consensus earnings estimates (especially in the Information Technology sector) even as the Middle East crisis unfolded, and a good start to the Q1 earnings results reporting season from the Financials sector.
Furthermore, we see evidence that some fast-money hedge funds were not well-positioned for the swift, snapback rally. As the market ticked higher and higher, it likely engendered more and more buying from this group.
Crude oil no longer flashing red
The U.S. and global equity rebound has occurred amid crude oil prices shifting from flashing red to yellow.
The price of physical Brent oil sold to buyers retreated to about $116 per barrel on Thursday, according to Bloomberg, down from a peak of $144 per barrel on April 7.
While that is still quite lofty and well above the Brent futures (paper) price, the latter has retreated as well, to around $99 per barrel in midday trading during the same session.
RBC Capital Markets, LLC’s Head of Global Commodity Strategy and Middle East and North Africa Research Helima Croft wrote, “From our standpoint, we certainly see scope for the continuation of the ceasefire, as a respite from drone and missile attacks is likely advantageous for both sides. However, as long as the molecules are not moving through the Strait, the economic cost will mount ahead of summer, even if market participants continue to price in a peace dividend.”
Inflation to tick higher
Despite signs of de-escalation in the Middle East crisis, many developed and emerging economies are now grappling with inflation and economic growth headwinds caused by the energy price shock.
The impact appears less acute for the U.S. but is not immaterial, from our vantage point.
The Consumer Price Index (CPI) rose to 3.3 percent in March, surging nearly 1.0 percent compared to the previous month, a pace reached only during serious bouts of inflation, including those in the 1970s and early 1980s.
No surprise, the culprit was mainly higher gasoline prices, which shot up 21.2 percent month over month.
Following the inflation report, RBC Economics raised its full-year 2026 CPI forecast to 3.2 percent, a bit higher than the 3.1 percent consensus forecast.
Assuming oil prices don’t leap again and the crisis is resolved soon, our economists expect inflation to peak at 3.7 percent in Q2 before pulling back to 3.0 percent by year end, not much higher than where it stood earlier this year.
Normally, a brief bout of 3.0 percent-plus inflation can be absorbed by households and businesses without much trouble. But this is happening on top of a significant inflation wave.
Consider that on a cumulative basis, consumer prices have risen over 27 percent since COVID hit in early 2020—and that’s just the official data. We suspect reality is higher.
If energy prices remain elevated for a prolonged period or increase again—in other words, should the Strait of Hormuz take longer to open up than markets are currently assuming—this new bout of inflation could become more broadly entrenched in the economy, hitting goods and services prices (aka core inflation).
If a lengthy energy supply shock unfolds, strains on global supply chains could surface.
RBC sees higher U.S. inflation and lower growth than the consensus forecast
Progression of 2026 consensus forecasts and current RBC Economics forecasts
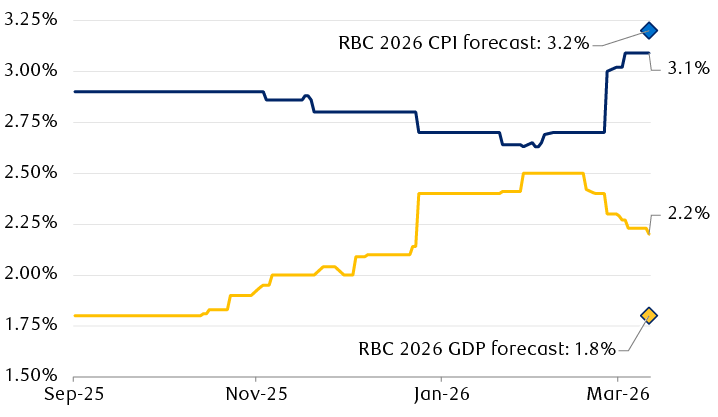
Source - RBC Wealth Management Fixed Income Strategies, RBC Economics, Bloomberg; data through 4/10/26
The chart shows the progression of the 2026 consensus U.S. Consumer Price Index (CPI) and Gross Domestic Product (GDP) forecasts for 2026 starting in September 2025 through April 10, 2026 along with current RBC Economics forecasts for both. The CPI forecast began at 2.9%, then drifted lower, reaching 2.63% in early March 2026. It moved up slightly thereafter and then jumped to above 3.0% in late March, before settling at 3.1% recently. RBC's current CPI forecast is shown at 3.2%. The consensus GDP forecast started at 1.8% and drifted up in November and December 2025. It then jumped in January 2026 and moved higher in early March, peaking at 2.5%. It started to move lower in mid-March and has moved down to 2.2% recently. RBC's current GDP forecast is shown at 1.8%.
GDP growth to slow
When the Middle East crisis began, the U.S. economy looked like it was on relatively solid footing. However, downward revisions to prior data by the Bureau of Economic Analysis indicate the economy instead had been somewhat wobbly.
In April, Q4 2025 GDP growth was revised lower for the second time, to only 0.5 percent, whereas the initial reading had been 1.4 percent back in February.
RBC Economics recently cut its 2026 GDP growth forecast to 1.8 percent, beneath the 2.2 percent long-term average and consensus forecast. By way of comparison, GDP growth was 2.1 percent in 2025.
Since 1990, below-trend GDP growth between 1.1 percent and 2.0 percent has delivered mid-single-digit S&P 500 price returns (not including dividends), on average, according to RBC Capital Markets.
Our economists still don’t see elevated recession risks at this point. Households should be able to tap into savings to blunt the immediate inflation impact before pulling back on spending on non-energy goods and services.
Furthermore, we think high-income households—those that benefit the most from the “wealth effect” associated with stock market gains and the cohort that impacts overall American household spending far more than others—are unlikely to rein in spending much despite the challenging inflation period. The stock market rally has helped, and this group has significant savings and is the biggest beneficiary of the One Big Beautiful Bill Act’s approximately $50 billion of additional income tax refunds.
A window of time for the economy
RBC Global Asset Management Inc.’s Chief Economist Eric Lascelles wrote, “The economic rule of thumb is that spillover effects should be limited until an energy shock has lasted for 3–6 months, at which point the danger starts to grow. This war is currently just 1.5 months old and has a good chance of being resolved before that danger zone is entered.”
We continue to recommend that investors remain committed to equities in portfolios up to but not beyond the long-term strategic asset allocation level.