The S&P 500 has continued to surge amid rather low volatility, making new high after new high—31 of them in 117 trading days so far this year.
It’s beautiful on the one hand. Who doesn’t like a year-to-date rally of 15.0 percent (15.8 percent including dividends) that has unfolded in less than six months? This is almost 1.5 times the average annual price gain of the past 40 years.
On the other hand, it’s frustrating for some holders of well-diversified portfolios that include individual U.S. equities. A small group of stocks has dominated, with the overwhelming proportion of them tied to artificial intelligence (AI) earnings optimism and hype:
- Just one stock, AI chipmaker NVIDIA, represents 33 percent of the S&P 500’s year-to-date gain.
- Seven stocks make up another 38 percent of the gain, six of which are also leveraged to AI (pharmaceutical company Eli Lilly being the exception).
- The other 499 stocks in the index during this period represent only 29 percent of the total return.
A small group of stocks has powered the S&P 500 higher
Contribution to the S&P 500’s year-to-date gain of 15.8%
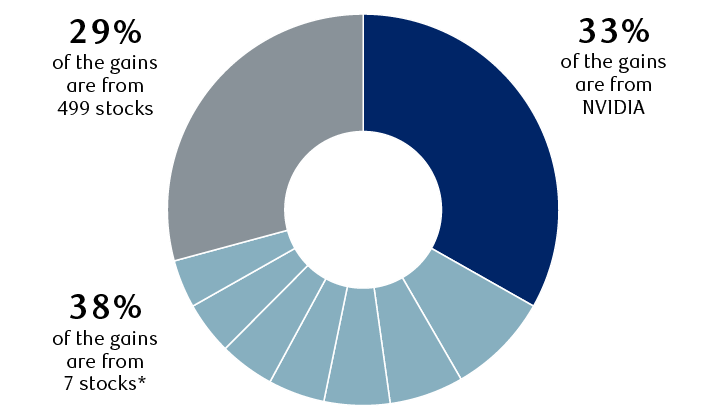
The circular chart shows categorized contributions to the S&P 500 year-to-date gain of 15.8%. NVIDIA represents 33% of the gains. Seven stocks represent 38% of the gains: (ranked from largest to smallest contribution) Microsoft, Alphabet (both share classes), Meta Platforms, Amazon.com, Broadcom, Apple, and Eli Lilly. The other 29% of gains are from 499 stocks.
* The seven stocks, from largest to smallest contribution to the S&P 500 total return, are Microsoft, Alphabet (both share classes), Meta Platforms, Amazon.com, Broadcom, Apple, and Eli Lilly.
Source - RBC Wealth Management, FactSet; year-to-date total return data (includes dividends) through 6/18/24. During the period, 507 stocks were in the S&P 500 (Alphabet counted once)
Other sides to the story
The complete group of Magnificent 7 stocks is no longer driving performance, as was the case much of last year.
Lately, the market has been driven by just four Magnificent 7 stocks (NVIDIA, Apple, Microsoft, Alphabet) and chipmaker Broadcom. Since the mid-April low, these five AI-leveraged companies have accounted for an outsized 67 percent of S&P 500 gains—a very lopsided rally.
In addition to the AI theme, we think the news associated with slower economic growth has played a role. Stocks with secular (long-term) growth characteristics have historically outperformed when economic growth is below average, mainly because their earnings growth prospects are viewed by investors as sturdier.
But at least since mid-April, we also perceive that “FOMO” has been powering these five AI-leveraged stocks—the psychological phenomenon known as the “fear of missing out.” This happens when some institutional and individual investors chase the biggest winners, especially when the hype about a particular investment theme becomes larger than life, like AI has.
While FOMO periods can last a lot longer than one might think is rational, they can also change shape or end when it’s least expected.
Pricey doesn’t necessarily mean problematic
The other knock against the rally is that it has pushed valuations back up. From our vantage point this isn’t as troubling as it might seem.
The S&P 500’s 21.3x forward price-to-earnings ratio is now well above the 18.5x average since early 2016. Statistically, this is around 1.2 standard deviations above the mean, according to Bloomberg Intelligence. This is a level we interpret as being stretched, although not yet near the 2.0 or above level that we would consider as being very excessive.
When the AI-leveraged Magnificent 7 stocks are stripped out, the valuation is lower at 18.4x, as the chart at right shows. We view this as less problematic and more reasonable as it is around 0.7 standard deviations above the mean.
S&P 500 valuation is more reasonable excluding the Magnificent 7 stocks
S&P 500 forward price-to-earnings ratios based on Bloomberg consensus earnings forecast
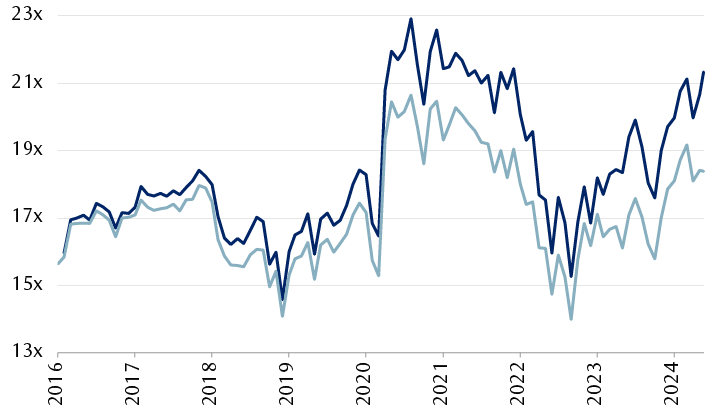
The line chart compares the forward price-to-earnings (P/E) ratios since January 2016 of the S&P 500 as a whole and the S&P 500 excluding the “Magnificent 7” stocks (Microsoft, Apple, NVIDIA, Alphabet, Amazon.com, Meta Platforms, and Tesla). The two data series are similar in 2016 and 2017, starting from around 15.8x and ending at about 18x. The two series started to separate after that, but the gap wasn't very large through the early part of 2020. Then, starting in the spring of 2020, the P/E ratios of both jumped sharply and the gap between the full S&P 500 and the S&P 500 without the Magnificent 7 widened meaningfully. In August 2020, the S&P 500 P/E reached a peak of 22.9x, whereas the S&P 500 excluding the Magnificent 7 was 20.6x, also a peak. After that, even though P/E for both declined, the gap remained wide through much of 2021. Subsequently, P/E ratios declined further and the gap narrowed. The S&P 500 P/E reached 15.2x in August 2022; the S&P 500 excluding the Magnificent 7 reached a low of 14.0x; both were among the lowest levels on the chart. During that time and soon thereafter, the gap remained narrow into early 2023. But then the gap widened again as P/Es for both pushed higher. The most recent datapoint on June 18, 2024 has the S&P 500 P/E at 21.3x and the S&P 500 excluding the Magnificent 7 at 18.4x, which is among the widest gaps since 2016.
* The Magnificent 7 stocks are Alphabet, Amazon.com, Apple, Meta Platforms, Microsoft, NVIDIA, and Tesla.
Source - Bloomberg Intelligence, RBC Wealth Management; month-end data except final data point from 6/18/24
Importantly, however, Bloomberg Intelligence points out that the valuation gap between the S&P 500 and S&P 500 ex-Magnificent 7 stocks is abnormally high at about 1.8 standard deviations above the mean. For us, this is getting too close for comfort to the 2.0 standard deviation level that we consider as excessive.
Remember, retreats are a normal part of rallies
We think the S&P 500 has gotten ahead of itself and the U.S. market is due for a normal pause or pullback in the coming weeks or months. Now is not the time to chase the biggest winners, in our view.
Heading into the Q2 earnings season, which will begin in mid-July, consensus earnings forecasts for this year and next seem dependent on average or better GDP growth, yet recession risks still linger. The U.S. presidential election campaign could stoke volatility as institutional investors start to focus on the debates and political party conventions this summer.
We recommend holding Market Weight exposure to U.S. equities. Amid what we perceive as FOMO activity, individual investors should stick to their long-term investment plan.