United States equities
The U.S. stock market has faced multiple challenges so far this year, yet it has climbed the wall of worry. The S&P 500 Index has rallied 8% and the Information Technology sector has surged 17% year to date through June 11.
At first glance, the market may seem disconnected from reality, especially considering Americans’ negative assessments of the economy in multiple opinion polls. However, corporate earnings have been the great stabilizer. The market’s profit outlook for 2026 and 2027 has brightened notably compared to the beginning of the year.
Any reservations we had about earnings prospects have been put to rest due to the Information Technology sector’s very robust Q1 year-over-year profit growth of 49% and evidence that AI capital spending could continue to rise over the near term, if not longer. Consensus earnings growth forecasts for Technology and other sectors have been revised upward, including for Energy due to elevated oil prices caused by the Middle East conflict.
The more buoyant S&P 500 profit outlook checks the box of one catalyst we thought was necessary for the bull market to persist for a fourth consecutive year in 2026.
With the midterm elections approaching on November 3, we’re mindful that the market faces another obstacle—and a historical one at that. The S&P 500 has experienced an average 21% correction surrounding midterm election years since 1934, as we discussed in a recent report.
Given the market has already endured a brief 9% pullback last spring, this begs the question: Has the usual midterm election year performance hiccup been satisfied? Maybe, but we can’t exclude the possibility that another pullback could occur, especially if the Strait of Hormuz remains largely closed, Treasury yields continue to rise due to inflation risks, and/or midterm election angst materializes.
We suggest maintaining a Market Weight position in U.S. equities. In order to manage risk, we would scrutinize equity holdings as some stocks in the Technology sector (especially semiconductors) have rallied sharply and could face bouts of significant volatility and/or correct meaningfully. Therefore, investors should be vigilant about single-stock and sector exposures in portfolios by bringing them back into balance if they’ve drifted well out of bounds.
S&P 500 and six sectors forecast to deliver double-digit earnings growth this year
2026 earnings-per-share consensus growth estimates (year over year)
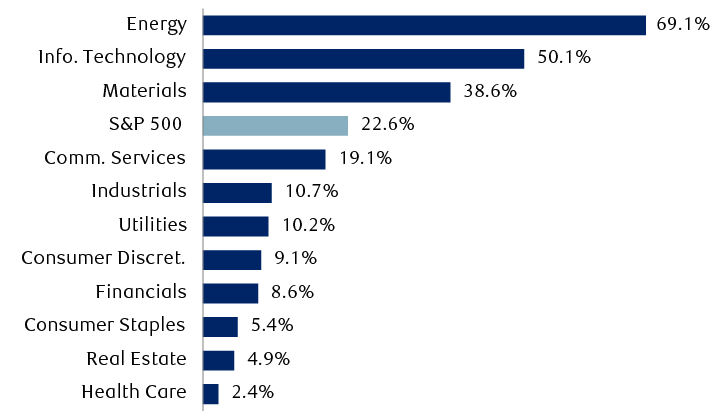
Source - RBC Wealth Management, Bloomberg; data as of 6/10/26
The bar chart shows 2026 earnings-per-share consensus growth forecasts as follows: Energy 69.1%, Information Technology 50.1%, Materials 38.6%, S&P 500 22.6%, Communication Services 19.1%, Industrials 10.7%, Utilities 10.2%, Consumer Discretionary 9.1%, Financials 8.6%, Consumer Staples 5.4%, Real Estate 4.9%, and Health Care 2.4%.
United States fixed income
Our base case remains that the Federal Reserve will keep policy rates on hold for the balance of 2026, but with a growing bias toward a potential rate hike. While we think this should anchor Treasury yields around current levels, it clearly introduces some upside risks to our current forecasts (see chart below). We see scope for the benchmark 10-year Treasury yield to test key highs from this cycle: 4.8% from 2025 and potentially the 5.0% level from 2023.
While the Middle East conflict—and the associated rise in oil prices and inflationary risks—could be seen as the sole culprit of the market’s flip-flop from pricing further Fed rate cuts earlier this year to now expecting at least one rate hike, we think that misses the big picture. If we take a step back, the U.S. economy remains remarkably resilient, largely supported by continued consumer strength and, to a much greater degree, the massive AI-related capital investment that is ongoing. Inflation has remained above the Fed’s target for years, major U.S. stock market indexes remain near record highs, and the unemployment rate at 4.3% remains essentially in line with the Fed’s estimate of “maximum employment.” Put simply, all signs point to the idea that Fed policy at a minimum is correctly calibrated, with an argument to be made that rates may have been cut too far last year.
Credit markets remain historically rich, offering a scant 0.73% of incremental yield over comparable Treasuries and among the tightest levels seen since 2000—implying minimal credit risks at the moment. That of course jibes with our solid economic outlook, but it leaves few attractive opportunities for bond investors. That said, all-in yields remain attractive with the Bloomberg US Investment Grade Corporate Bond Index yielding 5.3%, compared to an average of 4.7% over the past five years. Additionally, bank-issued hybrid preferred bonds offer an attractive alternative to corporate bonds, in our view.
With the Fed likely on hold, we see Treasury yields trading around current levels
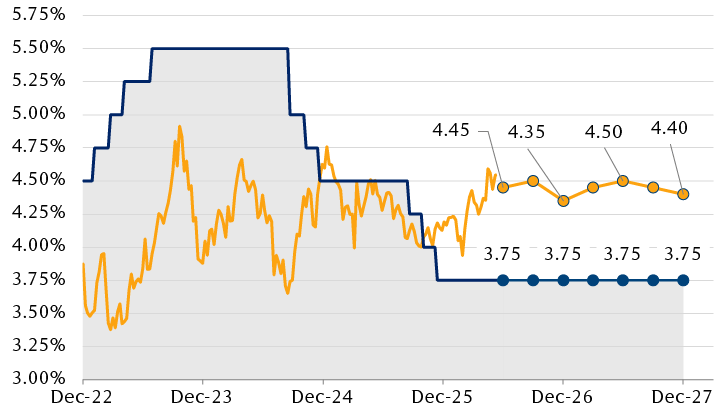
Source - RBC Wealth Management, RBC Capital Markets, Bloomberg
The chart shows the yield on the 10-year U.S. Treasury bond and the federal funds rate from December 2022 through June 8, 2026, and quarterly estimates of both through December 2027. The federal funds rate rose to 5.50% in 2023, then began to fall in September 2024 to its current level of 3.75%, where it is projected to remain through 2027. The 10-year Treasury yield has moved between roughly 3.50% and 4.75% since December 2022; it is currently around 4.50% and projected to remain between 4.35% and 4.50% through the end of 2027.