The U.S. government has an incomprehensible amount of debt. The number is so large—$35 trillion and counting—that we think it has lost any meaning. We find it incredible that Treasury debt to other U.S. government agencies—if broken out as a standalone—would itself be the third-most indebted nation on Earth, after the U.S. and Japan. Interest on the debt will soon be a trillion-dollar expense, larger than U.S. government spending on veteran benefits, education, and transportation combined.
The magnitude of these numbers has created a cottage industry of doom forecasting, with plenty of hyperbole but little analysis. We have previously discussed what we see as the realities of the U.S. national debt, but we think it’s helpful to take another look at some of the more pernicious and persistent debt myths.
Myth #1: The U.S. economy is dangerously overleveraged
The biggest source of confusion that we see on the U.S. debt is that the number tells us something important. It doesn’t—at least not by itself. That’s because the government is only a small part of the U.S. economy. What matters for macroeconomic purposes is how much all stakeholders, public and private, have borrowed. And when we layer in household and corporate borrowing, it’s apparent that the U.S. debt picture is relatively benign. Canadians, for instance, have leveraged more of their future production than Americans have, and U.S. borrowing is on par with Sweden and the UK.
Not so very different after all: A broader measure of indebtedness shows the U.S. is fairly typical
Debt as percentage of GDP
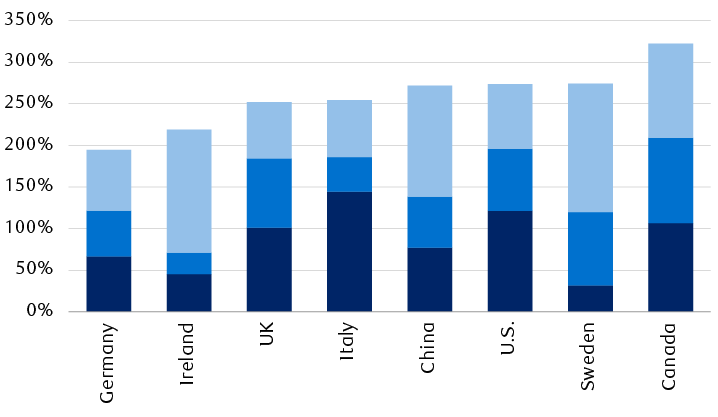
The column chart shows debt in 2022 as a percentage of national gross domestic product (GDP) for eight countries (ordered from least to most total debt): Germany (194% of GDP), Ireland (219%), the United Kingdom (252%), Italy (254%), China (272%), the United States (273%), Sweden (274%), and Canada (322%). Debt is broken down into categories of general government debt, household debt, and nonfinancial corporate debt.
Source - International Monetary Fund; percentage of 2022 GDP including bonds, loans, and debt securities
Worrying about government debt is analogous to someone claiming to be debt free because they paid off last month’s credit card bill. That’s a tough argument if the person still has a mortgage, car loan, or student debt. Whether at the household or the national level, we’re unlikely to reach the right conclusion if we only look at one slice of the pie.
Myth #2: Investors need to prepare for an upcoming U.S. default
Defaults generally occur when borrowers lack the resources to fulfill their promises. That’s not likely to happen for the U.S. government, since the Treasury has only promised to give investors a set number of dollars at specified future dates. By happy coincidence, the U.S. government can manufacture dollars at the push of a button. In those circumstances, it would be an active choice for the U.S. to fail to meet its obligations. And given the lifespan of political careers after a sovereign default, we think it’s a choice U.S. leadership is not going to make.
As we’ve discussed before, the legitimate concern around excess borrowing is not default but inflation. The dollars will be paid as promised, but investors won’t be able to buy as much with the proceeds. This is a genuine risk. But it’s a much different concern than default. Sovereign defaults are economic catastrophes for most strata of society and tend to precede years of slow growth. Inflation is a serious problem, but it’s easier to deal with and usually orders of magnitude less severe than defaults.
Myth #3: Blame the politicians, they’re the ones in control
The prevailing narrative is that profligacy created our debts. Whether its crazy spending programs or unfunded tax cuts, debt is just a result of poor political leadership.
To be fair, there’s an element of truth to that view. Raising taxes is a political no-go, and there are certain programs that must be funded. Unfortunately, the uncuttable program costs exceed the un-raiseable tax proceeds. That’s a structural political issue, and it’s likely here to stay for the foreseeable future.
But the reality is the big run-up in government borrowing hasn’t been a result of political will. The biggest increases are from the global financial crisis and the pandemic. Without those two events, the U.S. debt-to-GDP ratio would likely be around 40 points lower. It’s difficult to argue, in our view, that politicians really had a choice when COVID struck or when the banking system veered toward collapse.
This again highlights the point that the government is only a relatively small part of the economy. If we look back to the last U.S. budget surplus in the 1990s, there were movements to control spending and raise taxes, but a major driver of the surplus was the rise of the internet and the concurrent economic growth.
Debt reduction is less about annual fiscal budget tightening than about avoiding catastrophes and reaping the fruits of innovation.
U.S. debt rise is driven by crisis response
Federal debt held by the public (% of GDP)

The chart shows the percentage of U.S. federal debt held by the public as a percentage of national GDP, and compares it with the year-over-year change in the measure. The chart shows that nearly half of existing debt was created in 2009-2013 and in 2020.
Source - RBC Wealth Management, Bloomberg; 2024 and later represents Bloomberg consensus forecast
Myth #4: Reducing debt will make everything better right away
The old adage to “be careful what you wish for since you just might get it” is particularly apt when it comes to investors and government debt reduction.
The rise in U.S. government debt has been accompanied by solid investment returns across most—if not all—asset classes. Debt-funded government spending played a real role in those results. At its core, debt is about moving demand through time; borrowing adds to today’s demand and repayment reduces today’s demand. If the U.S. were to shift to debt reduction, it’s very likely that economic growth—and by extension corporate earnings—would decline, at least in the short term. Investor optimism around lower debt could help offset some of the effects of slower growth, but there is little empirical support for that idea.
Reality check
Despite the scary and oft-repeated headlines around U.S. debt, we struggle to see what keeps the fear going. Equity markets are at or near all-time highs; borrowing costs across the economy are largely manageable; and economic growth is strong with inflation declining. This has largely been the case for the U.S. for most of the past four decades, a period marked by rising government debt.
Is every dollar of U.S. government spending efficient? Of course not. Could tax policy be made more rational and do a better job of fomenting growth? Absolutely. But it’s a far cry from saying the world is not ideal to saying that we are on the verge of an economic apocalypse. To us, that leap, like much of the discussion on the U.S. debt, is better suited to economic mythology than financial reality.