Reasons for the selloff
Concerns that the U.S. economy faces heightened recession risks, coupled with sentiment that the Federal Reserve is behind the curve in cutting interest rates, sparked a rapid U.S. and global equity market selloff. The S&P 500 Index has declined 8.5 percent from its mid-July peak through August 5.
What began as a mild, normal pullback in the S&P 500 accelerated into a more forceful selloff following the Fed’s policy meeting on July 31 and the weak U.S. employment report on August 2, which saw fewer jobs created and a higher jump in unemployment than the consensus forecast of economists had projected. The unemployment rate climbed to 4.3 percent in July from 4.1 percent in June.
While a 4.3 percent unemployment rate might not seem high to those who remember much loftier levels years and decades ago, market participants are focused on the magnitude that unemployment has climbed since it bottomed at the unusually low level of 3.4 percent in January 2023. Such a jump typically means employment indicators are flashing warning signs for the U.S. economy.
U.S. manufacturing data has also underwhelmed. July ISM Manufacturing sentiment came in below the consensus forecast at 46.8 and has registered below 50.0 (the demarcation line between expansion and contraction) for 20 of the last 21 months. Based on data since 1948, the only other time this happened for such a long stretch was in 1989–1991, a period that included a brief recession.
The weak economic data came shortly after disappointing quarterly earnings reports from some of the so-called Magnificent 7 technology stocks that are leveraged to the artificial intelligence theme. Specifically, some institutional investors were bothered by the lack of transparency on company conference calls regarding when and whether the benefits of tens of billions in AI capital spending would pan out. Moreover, the S&P 500 Q2 earnings season overall signaled some additional cracks in consumer spending trends. These developments gave additional impetus for the selloff.
An important factor that has received less attention than it probably deserves is the impact of Japan’s central bank policy on global currency markets. The Bank of Japan hiked interest rates last week and signaled further hawkish moves, to the surprise of some institutional investors. This contributed to the global equity market selloff because it caused the yen to spike versus the U.S. dollar, upending some currency trades that institutional investors had in place.
We perceive that some fast-money hedge funds had been using the weak yen to fund some of their leveraged investments in Magnificent 7 stocks, other AI-related stocks, and risk assets overall—some of which were likely leveraged trades on margin. When the yen spiked, we think it forced an unwinding of trades across equities and other risk assets. Individual investors shouldn’t underestimate the ability of fast-money hedge funds to exacerbate day-to-day market swings, in our view.
Another factor is that equity markets often experience seasonal weakness at some point during the August to October time frame.
And we think potential military escalation in the Middle East conflict following the assassination of Hamas political leader Ismail Haniyeh in Tehran last week is on the minds of institutional investors.
Add to all of this, U.S. political instability with an assassination attempt on the Republican presidential candidate and then an abrupt change at the top of the Democratic ticket probably hasn’t helped matters. While these circumstances are highly unusual, It’s not unusual for the market to experience volatility at some point during presidential election years.
Pullback in perspective
Now, some perspective. The U.S. equity market had been on a very strong run:
- The S&P 500 climbed 37.6 percent from late October through mid-July 2024.
- The tech-heavy Nasdaq rallied 48.1 percent over roughly the same period.
- The Bloomberg Magnificent 7 Index surged 80.4 percent during this time.
- Until the latter part of July, the S&P 500 had gone 357 trading sessions without a two percent or more single-session decline. This was highly abnormal by historical standards.
- When the market was near its July peak, the S&P 500’s price-to-earnings valuation was rather stretched at 21.3x forward consensus estimates compared to the 18.5x average since early 2016, mainly due to the high valuations of Magnificent 7 stocks. Excluding this basket of AI-leveraged stocks, the valuation was also elevated at 18.4x, but not as extreme, in our assessment.
Given these strong moves and elevated valuations across the market, a selloff that was triggered by a bout of weak economic data, renewed recession concerns, and worries about Fed policy shouldn’t be considered as surprising.
U.S. market pulls back following a strong run
S&P 500 Index
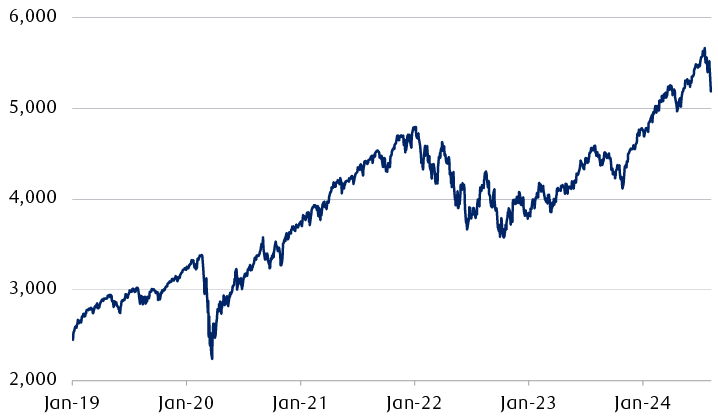
The line chart shows the S&P 500 Index from the beginning of 2019 through August 5, 2024. The Index started the period at almost 2,500 and rallied to about 3,400 in February 2020 before falling sharply to about 2,200 in March 2020. It quickly rebounded and reached over 4,700 in January 2022. It then sold off through much of 2022, reaching a low of around 3,600 in October 2022. It subsequently rebounded to around 4,500 in July 2023, only to dip to around 4,100 in October 2023. From that point, it rallied strongly to a peak of 5,667 on July 16, 2024 before pulling back to 5186 on August 5, 2024.
Source - RBC Wealth Management, Bloomberg; data through 8/5/24
More to come?
Is this a short-term pullback or will this morph into a move that takes the market into a deeper, longer-lasting downturn?
From our vantage point, it’s an open question on whether the U.S. economy is merely experiencing a growth scare or heading into a recession.
How this gets resolved will likely set the path for the equity market.
During growth scares, a range of economic indicators usually soften and recession fears rise, but an economic hard landing doesn’t materialize. Growth scares happen when economic data becomes wobbly, and the market becomes concerned Fed policy is not properly calibrated, or when unexpected outside factors influence the economy and market performance.
The five growth scares since 2010 have prompted S&P 500 pullbacks between 16.0 percent and 25.0 percent.
The most recent growth scare occurred in 2022 and led to a 25 percent decline, but once the economic clouds lifted, the market was off and running higher again, led by the Magnificent 7.
Recessions can provoke deeper and longer-lasting downturns. Surrounding 13 recessions since the late 1930s, the S&P 500 declined 31.8 percent, on average, and for 12 of those periods it took the market almost five months following its peak level to reach a trough, on average. However, on all but one occasion the market bottomed before the recession ended.
We have been warning that recession risks are rising. In late June, three of the seven leading economic indicators in our Recession Scorecard were flashing red, and the unemployment metric was threatening to deteriorate. Now that the unemployment rate has jumped, this indicator has flipped to red, pushing four of the seven indicators into that column.
U.S. Recession Scorecard
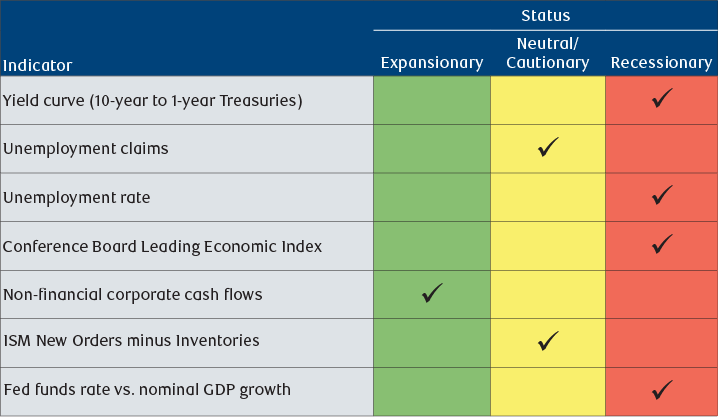
The graphic presents seven indicators of the state of the U.S. economy. A single indicator is currently classified as “Expansionary”: Cash flows of non-financial corporate businesses. Two indicators are classified as “Neutral/Cautionary”: Unemployment claims; and ISM New Orders minus Inventories. The remaining four indicators are classified as “Recessionary”: the yield differential of 10-year to 1-year U.S. Treasuries; the unemployment rate; the Conference Board’s Leading Economic Index; and the federal funds rate vs. nominal GDP growth.
Source - RBC Wealth Management
The number of unemployed persons in the U.S. is now 21 percent higher than it was just 18 months ago. Rising unemployment goes beyond the decline in spending power for those who have lost jobs. The larger impact comes from the increase in precautionary savings on the part of employed people who take the worsening unemployment rate as a signal to prepare for a rainy day.
In our view, the steady rise in the unemployment rate, at a time when consumer confidence is already low and the excess household savings built up during the pandemic is fully depleted, removes important bricks from the wall that had been supporting the idea of a “soft landing” for the U.S. economy.
Legs of support
There are some important factors in the market’s favor:
- Corporate earnings have not yet hit a wall: Despite a less-than-perfect Q2 earnings reporting season and some slippage in earnings and revenue beat rates by S&P 500 companies as a whole, overall earnings reporting season statistics are holding up so far, in our assessment.
- S&P 500 consensus earnings estimates are sturdy: Full-year 2024 ($244 per share) and 2025 ($280 per share) consensus forecasts continue to call for profit growth, and both have barely budged over many months. This trend is much better than usual because typically the current-year earnings forecast has retreated by almost 6.0 percent by this point in the year.
- Management teams have yet to signal distress: RBC Capital Markets, LLC’s Head of U.S. Equity Strategy Lori Calvasina wrote, “As we’ve read through earnings call transcripts from the past week, we don’t come away with the impression that views on the macro backdrop or the earnings outlook are eroding in a significant way … Descriptions of the macro outlook and demand backdrop continue to acknowledge various headwinds and buffers, and have mostly maintained a balanced tone … One comforting data point to us is that U.S. companies appear to be emerging from a mild earnings recession, not heading into one.”
- Earnings growth rates are expected to become more balanced: Within the S&P 500, the consensus year-over-year growth rates for Magnificent 7 versus non-Magnificent 7 stocks are forecast to nearly converge early next year—meaning earnings growth for non-Magnificent 7 stocks is finally expected to improve after a long string of weakness.
- The market’s so-called “fear gauge” has spiked: The Chicago Board Options Exchange Volatility Index (VIX) briefly surged over 65 in midday trading on Monday and ended the session above 38, after being unusually low in the 12–15 range for most months stretching back to November 2023. Such a spike is often a contrary indicator for market performance—meaning the market has often rallied in the weeks and months after such spikes.
Playing defense in a volatile market
We think it’s too soon to tell whether a growth scare or recession will pan out, and Fed policy could certainly play a role.
We continue to recommend a defensive posture in equity portfolios, with an emphasis on high-quality dividend-paying shares.
While we don’t think there is enough evidence to conclude that a recession is a fait accompli, we think investors should make sure that core equity holdings comprise stocks that can better withstand further economic deterioration or a recession, and represent shares with valuations supported by prospects for earnings growth.