Unemployment rate
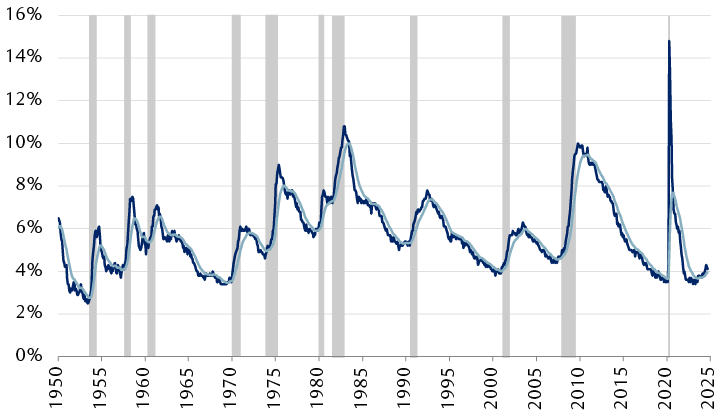
The unemployment rate fell for the second straight month. That decline has not altered its “red” status. The monthly rate has been above the smoothed trend for eight consecutive months, and that smoothed trend continues to rise. However, the gap between the two has narrowed, and we think two more months of a falling unemployment rate would, at the very least, muddy the picture.
U.S. monthly unemployment running above trend
U.S. unemployment rate and 3-month smoothed trend

The line chart shows the U.S. unemployment rate and its 3-month smoothed trend from 1950 through September 2024. Both the rate and the trend line have been rising since mid-2023, and the rate has been above the trend for eight months. In September, the unemployment rate was 4.1% and the smoothed trend value was 4.0%.
Source - RBC Wealth Management, Federal Reserve Bank of St. Louis (FRED); data through 9/30/24
The unemployment rate is important to the “recession/no recession” discussion for at least two reasons: because of its perfect track record of signaling the imminent onset of recession since it was first published in 1948, and because it factors mightily into Fed thinking about whether to and by how much to cut rates.
Fed Chair Jerome Powell, in the press conference following the Federal Open Market Committee’s September meeting, noted that the labor market had cooled and that the Fed would not welcome any additional weakness on the employment front. Many observers believed the Fed’s September rate cut was larger than normal because of the surge in the reported July unemployment rate to 4.3%.
Several factors argue in favour of the unemployment rate resuming its climb in the coming months:
- Temporary employment continued to fall even in September’s blowout payroll gains. Employers typically reduce temp jobs before they lay off permanent employees.
- The multi-quarter decline in the number of workers voluntarily quitting their jobs accelerated sharply lower according to the September report.
- Small business hiring plans remain well below pre-pandemic levels according to the National Federation of Independent Business.
- The already-rising percentage of respondents who reported jobs were “hard to get” jumped higher in the latest Conference Board’s Consumer Confidence Survey.
All the above have been useful leading indicators of where the unemployment rate was headed in the following six to 12 months.
ISM New Orders minus Inventories
This indicator has been wobbling around either side of zero. The New Orders Index taken by itself has been painting a negative picture for some time—22 of the past 24 months have shown new orders contracting for the manufacturing sector. However, inventories have also mostly been contracting over that stretch, leaving the net of the two indexes not telling us very much about the likely course of manufacturing from here.
Reading between the lines
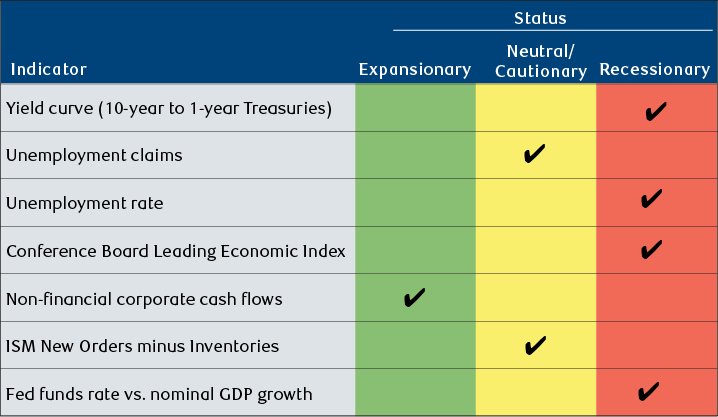
Overall, we think the scorecard is red enough to argue for a cautious, watchful approach to equity investing but, at the same time, not deteriorating at a pace that would unequivocally rule out the possibility of a soft landing for the U.S. economy.
U.S. Recession Scorecard

| Indicator | Status |
|---|---|
| Yield curve (10-year to 1-year Treasuries) | Recessionary |
| Unemployment claims | Neutral/Cautionary |
| Unemployment rate | Recessionary |
| Conference Board Leading Economic Index | Recessionary |
| Non-financial corporate cash flows | Expansionary |
| ISM New Orders minus Inventories | Neutral/Cautionary |
| Fed funds rate vs. nominal GDP growth | Recessionary |
Source - RBC Wealth Management
