Despite our moderately cautious outlook in the previous Global Insight Weekly technical update on Aug. 14, the S&P 500 has remained impressively resilient, barely pulling back and notching an additional two to three percent heading into mid-October.
However, while some mega-cap growth stocks have continued to march higher into early Q4, a broad list of stocks across many sectors pulled back meaningfully. For example, regional banks remained weak and sold off further on credit concerns while insurance, Industrials, retail, housing, Materials, and Energy stocks remained volatile through the balance of this past quarter heading into early Q4.
Key S&P 500 levels to monitor: The chart below reflects the above-mentioned dual reality within the S&P 500. The top panel illustrates the price of the S&P 500 marching steadily higher from the oversold lows in Q2 through Q3 with a narrow consolidation currently underway. Interestingly, the index has remained in a tight 3.25% trading range between 6,552 and 6,764, despite concerns regarding historically elevated valuations, ongoing China-U.S. trade and tariff disputes, ongoing geopolitical concerns, and volatility around corporate earnings. From a technical perspective, those levels are likely to prove important with a move in either direction outside of that range expected by us to signal the next direction move for the S&P 500. While it may seem overly simplistic, we think a rally above 6,764 would signal that investors are looking past the list of concerns in anticipation of a stronger earnings outlook. A break below 6,552 would signal to us the Q2–Q3 uptrend is stalling and a corrective phase is likely underway.
S&P 500 weekly price and quadrant balance measuring the percentage of S&P 500 stocks with rising momentum
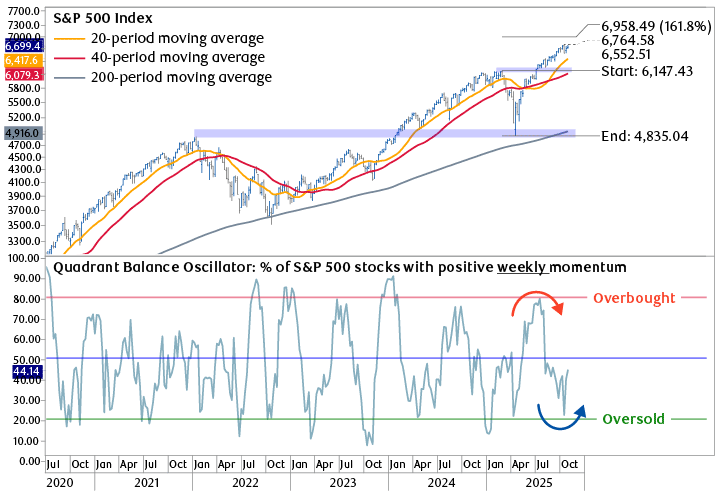
Source - RBC Wealth Management, Bloomberg, Optuma
The chart illustrates the price of the S&P 500 since July 2020 rising in an uptrend of higher lows and higher highs. The technical indicator in the bottom panel indicates the percentage of stocks within the S&P 500 with rising weekly momentum. This Quadrant Balance indicator has transitioned from a high or overbought level in early Q3 2025 to a low or oversold level in early October.
Peeling back the onion for a look at change underway within the S&P 500: In contrast, the volatile quadrant balance indicator in the bottom panel of the chart above reflects the behavior of the average stock in the S&P 500. This indicator tracks the percentage of stocks within the S&P 500 with rising weekly momentum which tells us how many stocks within the index are rallying or are in sideways to down trends over a three- to six-month time frame. This indicator was elevated (overbought) heading into the summer months and was one of the reasons we expected the market and many stocks to pull back moving into Q4. Now, however, this indicator is low (oversold) but beginning to turn up, suggesting to us that a growing percentage of S&P 500 stocks that have been weak for the past two to three months are beginning to improve.
A case to continue rebalancing: The bottom line from these two conflicting chart panels is that there is evidence of a rotation developing within the S&P 500, and it reinforces our view highlighted in August that investors should consider rebalancing portfolios. Many of the aggressive growth, high-momentum, and high-valuation stocks have begun to pull back quickly over the past few weeks while many of the lagging areas, such as Healthcare, select Consumer Staples, and even Energy, are beginning to stabilize and improve.
Gold and silver – What now? The chart below reflects the impressive rally in gold (top panel) and silver (bottom panel) that has developed in 2024 and 2025 following broad trading ranges between 2020 and 2024. Concerns regarding a declining U.S. dollar, expanding U.S. deficits, and global central banks accumulating gold have accelerated demand for both of the precious metals, with gold and silver surging 70% and 90%, respectively, in 2025.
What comes next for gold and silver?
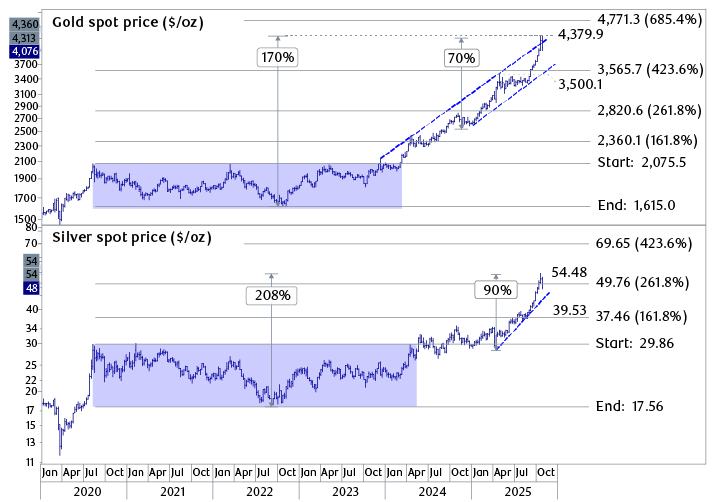
Source - RBC Wealth Management, Bloomberg, Optuma
The chart shows weekly spot prices for gold and silver in U.S. dollars per ounce from January 2020 through October 22, 2025. Both prices remained in a range from mid-2020 through mid-2024, and since then have risen steadily. Gold is now up 170% since Q3 2022 and 70% since Q3 2024. Silver is up 208% since Q3 2022 and 90% since Q2 2025.
However, the rally in both precious metals accelerated dramatically in September and into October with prices becoming very extended above their technical uptrends and steep corrections developing over the past week. We view the reversals in both metals to be part of a broader derisking process taking hold across more speculative market areas such as quantum computing, drones, and space-related equities, that were rising at an unsustainable pace over the past two months. The bottom line technically is that the long-term trends for gold and silver remain intact, but we caution traders not to expect an immediate rebound to new highs. After such a dramatic rally, we project a broad consolidation to develop, which we view as a healthy pause within their longer-term uptrends.