With the S&P 500 up 30 percent since the tariff scare low in April and higher by 10 percent year to date as of Wednesday’s close, the market is approaching what historically has been its most challenging month.
Since 1928, the S&P 500 has declined an average of 1.2 percent in September, underperforming all other months.
While that’s not a big decline in and of itself—after all, the market can decline by that amount on any given tough day—it’s a notable contrast to the average performance of other months.
The U.S. market has struggled the most in September
S&P 500 average monthly performance since 1928
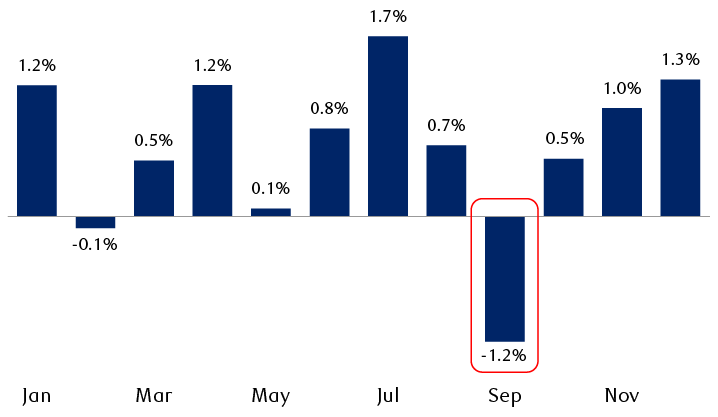
The bar chart shows average monthly S&P 500 performance from January 1928 through July 2025, with September the worst month and July the best month. Monthly averages: January, +1.2%; February, -0.1%; March, +0.5%; April, +1.2%; May, +0.1%; June, +0.8%; July, +1.7%; August, +0.7%; September, -1.2%; October, +0.5%; November, +1.0%; December, +1.3%.
Source - RBC Wealth Management, Bloomberg; monthly data through 7/31/25
September returns were negative 55 percent of the time since 1928, higher than the 39 percent proportion of negative returns in all other months during this period. Nine of the 40 worst monthly losses occurred in September, more than any other month. October, which also has a dubious reputation, followed with six of the 40 worst monthly losses.
Due to unique challenges facing the market, four of the past five Septembers struggled even more, retreating 4.2 percent on average, much worse than the long-term average 1.2 percent decline. While the S&P 500 finished last September in the green, the market dropped 4.3 percent early in the month as artificial intelligence semiconductor stocks sold off, before they and the broader market quickly rebounded. September returns in the preceding four years ranged from down 3.9 percent in 2020 when the pandemic was still a factor, to down 9.3 percent in 2022 when post-pandemic inflation was raging.
The September slide isn’t just a U.S. phenomenon. Stocks in Canada, the UK, and Hong Kong—in addition to markets elsewhere—also tend to struggle. Since 1970, the S&P/TSX Composite, FTSE All-Share, and Hang Seng have fallen by an average of 1.4 percent, 1.1 percent, and 1.0 percent, respectively, in September.
September struggles have been a global phenomenon
Average monthly performance of select indexes since 1970
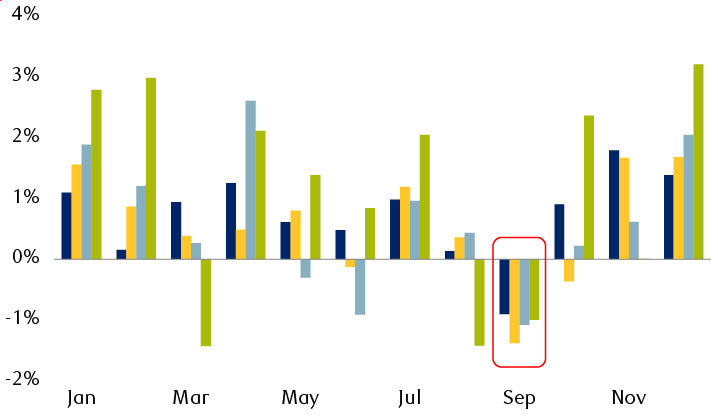
The bar chart shows monthly average performance from January 1970 through July 2025 for four equity indexes: the S&P 500 (U.S.), S&P/TSX (Canada), FTSE All-Share (UK), and Hang Seng (Hong Kong). December and January are historically the best months, and September is historically the worst month. Month-by-month performance is as follows. January: all four positive with Hong Kong the highest. February: all four positive, but with the U.S. barely up and Hong Kong up 3.0%. March: Hong Kong negative, others positive. April: all four positive, Canada lagging. May: UK negative, others moderately positive. June: U.S. and Hong Kong positive, but Canada and UK negative. July: all four positive, Hong Kong leading. August: Hong Kong negative, other three slightly positive. September: all four negative, ranging from -0.9% to -1.4%, with Canada down the most. October: Canada moderately negative, others positive. November: Hong Kong roughly flat, others positive. December: all four positive.
Indexes shown: S&P 500 (U.S.), S&P/TSX (Canada), FTSE All-Share (UK), Hang Seng (Hong Kong).
Source - RBC Wealth Management, Bloomberg; monthly data through 7/31/25
What affects the “September effect”?
From our vantage point, there is no single, objective reason why stock markets have often sagged in September. There are, however, a few factors that have likely contributed to this.
Window dressing: We believe the fiscal-year schedule of many mutual funds impacts seasonal autumn weakness. Institutional investors tend to clean up their portfolios in September and October before the fiscal year ends by selling their worst-performing stocks, and sometimes they add exposure to stocks that have performed better in the preceding months. This process is known as “window dressing”—in other words, they gussy up their portfolios before fiscal year-end performance and stock holdings are reported publicly. As they sell, the weakest stocks often lag the market or fall further. This can create volatility and hold back major equity indexes.
Tax-loss selling: This portfolio tax-management strategy in the U.S., Canada, and some other countries occurs in a variety of market situations—whether in an up, down, or relatively flat year—and can depend on individual portfolio circumstances. The worst-performing stocks are sold at a loss in order to limit or offset capital gains. While we think this has contributed to relatively poor September returns at times, the bulk of tax-loss selling (aka tax-loss harvesting) typically occurs later in the year.
Investor psychology: The fact that September is usually a weak month isn’t lost on institutional investors who manage hedge funds, mutual funds, or pension funds, nor on other investment professionals. The data have been well known and discussed for a long time. Perhaps September weakness became a self-fulfilling prophecy at some point, and prior seasonality begot subsequent seasonality. Some academic behavioral finance specialists have cited this as a potential factor.
Over the years we’ve also wondered whether September performance has been impacted by behavioral patterns associated with the return from summer break. We’ve observed that after this popular vacation period, investment professionals and individual investors are often rested and ready to start anew. They can be more open to changing short-term tactical strategies and/or cleaning up portfolios, although we’ve yet to see studies that back up this theory.
Fundamentals drive performance, not seasonal moves
September’s poor historical track record should not prompt long-term investors to make major portfolio adjustments, in our view. This seasonal cycle and other market cycles should be respected, but not dominate portfolio decisions.
We think other factors will primarily drive long-term U.S. stock market returns, just as they have over prolonged periods in the past, such as:
- The normal ebb and flow of the business cycle
- Federal Reserve policy
- Innovation
It’s those factors that tend to shape economic growth, corporate profit growth, and equity valuations the most—all of which are fundamental characteristics that meaningfully impact stock returns.
In addition to fundamental analysis, for short- and medium-term tactical portfolio positioning, we also think investors should take technical analysis into consideration.
But heading into September, the historical monthly downturn data provide a convenient reason to rebalance portfolios for investors who haven’t done so recently.
The U.S. and other equity markets have run up sharply since April and have posted outsized year-to-date gains, so equity exposure in portfolios may have drifted above the strategic recommended allocation level.
A bout of profit-taking and pullbacks in major indexes would be normal after such strong runs, if not in September, then at some point before year end.