

Key points
- As things stand, price-to-earnings ratios are not the risky component of the equity market equation—rather, it’s whether confidence will hold in the upbeat forecasts for earnings growth.
- The continued closure of the Strait of Hormuz leaves on the table the risk of much higher prices and perhaps outright shortages of oil, natural gas, and fertiliser, with negative consequences for all economies and corporate earnings generally. For the U.S., in our view, the bigger risk for earnings and the market uptrend lies in perceptions about the future trajectory of the AI complex.
- The biggest policy threat would come from a further broad-based surge in inflation that forces the Fed and others back into another series of rate hikes.
- Worries about all the above could provoke periodic bouts of market volatility; resolution of any could power another leg higher in the bull market uptrend.
All the major global equity indexes have put in new highs since the short-lived plunge triggered by the start of the Iran conflict. The same is true for breadth measures, including the equal-weighted versions of most indexes as well as the advance-decline lines for the S&P 500, the S&P SmallCap 600, the S&P MidCap 400, and the NYSE Composite.
In our view, the fact that breadth measures have gone to new highs along with the indexes themselves increases the probability that any market pullback which develops over the next several months will prove to be a correction rather than the beginning of a prolonged bear market. In the past, breadth, especially the advance-decline line for the S&P 500, has tended to peak months before the ultimate final high in a bull market.
Earnings are where it’s at
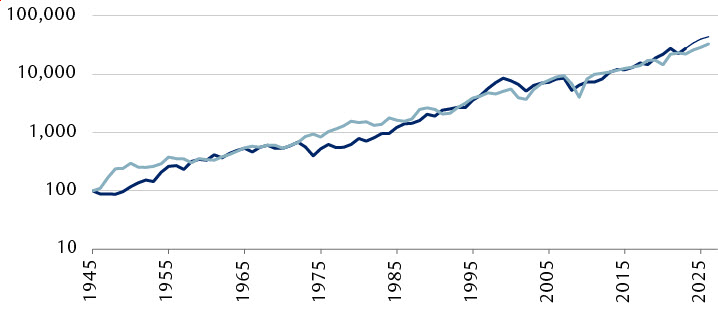
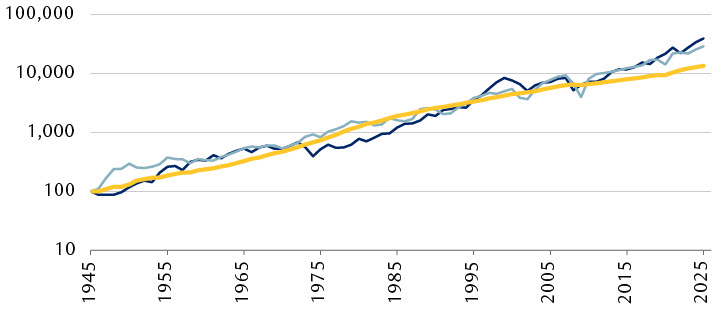
When trying to determine whether a stock market uptrend (or downtrend) has further to run or whether it is approaching a significant turning point, looking only at price makes the exercise not much better than a guessing game. But stepping back for a broader view, to bring the historical data into the picture and adding earnings to the mix, immediately removes much of the need for guesswork. That’s because it becomes clear the equity market historically moves pretty much in lockstep with earnings.
Since the end of World War II the S&P 500 has appreciated at a rate of 7.8 percent per annum. Over the same 80 years, index earnings per share grew at 7.4 percent per annum. Moreover, the zig-zag twists and turns that each experienced along the way were very nearly identical.
Which brings us to today. The S&P 500 has been performing very much in line with earnings growth. In fact, if anything, the correspondence between the two has been tighter than normal ever since the end of the global financial crisis. The S&P 500 price-to-earnings (P/E) multiple, based on consensus earnings estimates one year out, sits at 20 times. That’s somewhat elevated on a historical basis (long-term average is 18 times) but, in our view, it’s not especially rich for a market where earnings per share rose by 13 percent in 2025, are forecast by the consensus to advance by 26 percent this year, and by 17 percent in 2027.
It’s not the P/E multiple that appears “risky.” Rather, what gives us pause is the fact that S&P 500 earnings have grown at their fastest sustained rate ever from the end of the global financial crisis to today, and even faster over the past six years. Over that 17-year stretch, tech has become the dominant growth contributor in the economy as well as to equity market earnings and appreciation. This has accelerated further since the end of the pandemic, with the advent of AI as an emerging technology pushing tech and tech-related valuations up to 30 percent of the S&P 500’s total market cap, whereas the same grouping accounts for just 12 percent of GDP. This feels potentially precarious to us. A lot depends on AI playing out and achieving its advertised potential in a timely fashion.
Almost a dead heat
S&P 500 Index and S&P 500 earnings per share indexed to 100 at 1945 (log scale)
Source - RBC Wealth Management, FactSet, Bloomberg
A common path
S&P 500 Index, S&P 500 earnings per share, and U.S. nominal GDP indexed to 100 at 1945 (log scale)
Source - RBC Wealth Management, FactSet, Bloomberg
AI still at the wheel
So far, the AI story has unfolded in a way that supports its outsized contribution to corporate profits and stock market performance. Things kicked off with the arrival on the scene of OpenAI’s ChatGPT model back in 2022. Competing models quickly followed, as did the rapid proliferation of data centres and explosive demand for NVIDIA’s transformer chips.
The data centre build-out has had a powerful multiplier effect on the U.S. and several Asian economies. Beneficiaries include:
- Chipmakers of all stripes as well as the manufacturers/developers of chipmaking equipment
- Electric power producers (renewables, the rebirth of nuclear, natural gas) together with the suppliers of power plant and grid components and operating systems
- Cooling equipment manufacturers
- Software companies acting as consultants to corporations looking to integrate AI into their businesses
- Finance
The payoff everyone is aiming for is the integration of AI as a powerful corporate and consumer tool capable of delivering outsized, economy-wide productivity gains for a decade or more. Eye-catching progress on this front is a bit thin on the ground as of yet. Most corporate management comments talk about progress already achieved but emphasize “potential.”
Engagement rates have been rising rapidly. And it would be very hard to find a reporting company prepared to admit that it was not engaging with AI. But neither is it easy to find any transformative change in profitability convincingly linked to AI. However, it’s early days.
Data centre outlook getting more complicated
Meanwhile, the massive data centre build-out has further to run, according to most industry observers, but the picture is getting more crowded, complicated, and expensive. Developers are contending for scarce components: for example, water for cooling, as well as the cooling equipment itself. Chips are not always immediately available and neither, decisively, is electric power. The prices for all these, and for most other construction components, are substantially higher than they were last year or the year before that.
New power plants take longer to build than data centres and can involve complying with layers of regulatory requirements. And their construction often requires an electricity rate increase for all customers. This, understandably, is not popular with households already leaving a lot more of their paychecks at the gas station and grocery store than their budgets have room for. New York State has introduced a moratorium on new data centres. Other U.S. states are going slow on permitting or considering putting the cost of new electricity generating capacity onto the data centre developers. Ramping up new utility generating capacity is competing with the data centres for capital, skilled labour, and materials.
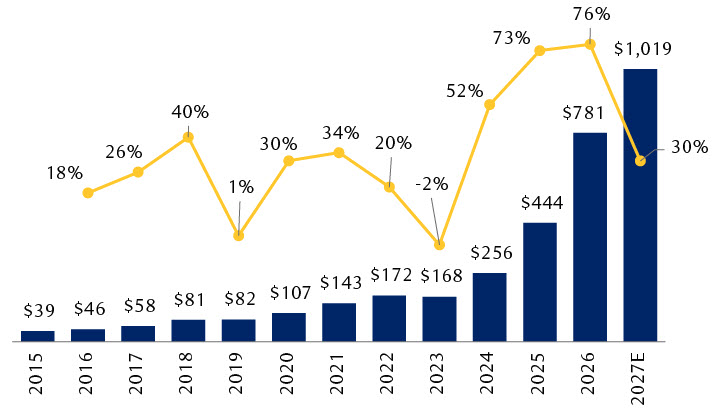
Now, a change of pace appears to be in the offing. Bloomberg estimates have capital spending by eight of the largest tech companies coming in a staggering 76 percent higher than last year, which itself was a 73 percent advance on 2024. However, estimates for 2027 growth in such outlays currently stand at a much slower 30 percent.
That would still leave the total capital expenditure in 2027 by this mega-cap group at more than $1 trillion, up by more than $200 billion from 2026. But in 2026, Bloomberg estimates the dollar growth will come in at $340 billion, so 2027 looks like it will mark a significant inflection point for the growth rate in data centre spending. Equity investors tend to care more about inflection points than absolute levels. That may be one reason why the shares of NVIDIA and most of the other so-called Magnificent 7 companies have underperformed the market over the past 12 months.
Mega-cap tech capex set to slow, but not decline
Combined annual capital expenditures of Alphabet, Amazon.com, Apple, Broadcom, Meta Platforms, Microsoft, NVIDIA, and Oracle
Source - RBC Wealth Management, Bloomberg
And new, competitive pressures are emerging within the AI space. A number of Chinese models have arrived on the scene, the most advanced of which is scored as being only half a step behind the most advanced “frontier” models from the leaders, ChatGPT and Claude. But it is also rated as much cheaper to use, according to the Artificial Analysis Intelligence Index. Many of the potential corporate and individual users of AI who do not need those very fast speeds or huge data access, which are features in the leading models, might reasonably be expected to opt for slower models, accessing narrower data and offering much lower cost.
The Wall Street Journal reports that some businesses which went “all in” on AI experimentation were hit by compute costs much higher than they expected. The same report says many firms are now putting internal limits on usage. Competition that meaningfully lowers costs should ultimately enable wider usage, engagement, and integration of AI. But it might also mean that it takes longer for the major hyperscalers to earn returns that justify their mammoth data centre investments.
Inflation the number one policy issue
Aside from the possibility the data centre build-out may be entering a less dynamic phase, we see other headwinds that could take a toll on equity markets. Inflation is at the top of the list. It is proving to be “sticky” everywhere and the return of U.S. tariffs suggests to us there is more upward pressure to come. But beyond tariffs, the reigniting of the conflict in the Persian Gulf is pushing the global economy closer to a more difficult phase. In our Global Insight 2026 Midyear Outlook published in June, we offered this hopeful view:
“… the trajectories of all economies, to one degree or another, depend on when the Strait [of Hormuz] reopens. Restoring the free flow of shipping would act to lower oil and natural gas prices and remove or reduce the threat of outright shortages—not just for oil and liquified natural gas but also fertilisers and some important industrial chemicals. This would substantially reduce operating costs for many businesses and sectors, especially agriculture where fuel and fertiliser are the largest inputs with a direct drive impact on global food costs. Lower prices at the pump and at the grocery store would provide welcome relief to household budgets and a boost to consumer confidence everywhere.”
Alas, with the resumption of hostilities, all those constructive expectations have been put on hold or worse. Higher oil and gasoline prices have already arrived, while painful shortages and higher food prices are looming. Central banks, including the U.S. Federal Reserve, are no longer able to comfortably “wait and see.” Bond yields have already moved higher.
Outlook still constructive
However, in our view, anything short of igniting a multi-hike Fed tightening cycle would be unlikely to push the U.S. economy toward recession or seriously derail the prospects for worthwhile earnings gains this year. But for most other developed economies it is likely to be a closer call.
We believe all the foregoing leaves open the possibility of an equity market correction playing out this summer/fall. That said, we do expect an eventual resolution of the Iran conflict and a reopening of the Strait of Hormuz, even though the terms might not make either side happy. When that arrives, we expect it would provoke a renewed upleg for equity markets.
At the risk of being repetitive, our positioning advice remains the same: portfolios should remain committed to equities up to but not beyond an investor’s long-term targeted exposure. Having a plan for how to become more defensive if conditions dictate is always a prudent thing to do, and one better undertaken before it is needed.