With semiconductor stocks significantly outperforming and driving most of the S&P 500’s 10.2 percent total return in the first half of the year, it’s tempting to relegate this to just a narrow advance.
However, the rally actually was quite broad:
- Seven of 11 S&P 500 sectors delivered above-average gains, and five sectors outperformed the index in the first half;
- The S&P 500 Equal Weight Index jumped 12.1 percent including dividends, outpacing the capitalization-weighted, Technology-heavy S&P 500; and
- The S&P indexes of small-cap and midcap stocks surged 23.9 percent and 17.3 percent including dividends, respectively, far exceeding large-cap indexes.
The U.S./Israel war with Iran, along with the related oil price spike and inflation, briefly jolted the market in March.
But the market quickly looked past those events as investors focused on very strong Q1 earnings growth and, importantly, meaningful upward revisions to profit estimates.
The S&P 500 consensus 2026 earnings growth forecast jumped from 13.6 percent at the beginning of the year to 23.3 percent by the end of June—a very unusual leap in such a short time, especially at this advanced stage of the economic cycle. The 2027 forecast currently calls for 16.1 percent growth.
Sturdy economic data and little-to-no tangible signs of economic deterioration on the horizon also supported stock prices. The consensus forecast of economists sees U.S. GDP growth at 2.1 percent for this year and next, roughly the long-term average level.
A new all-time high for the S&P 500 on strong earnings growth, overcoming the prior round of Middle East headwinds
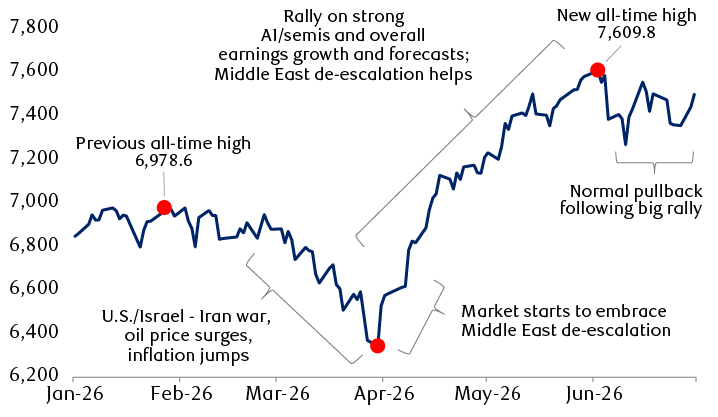
Source - RBC Wealth Management, Bloomberg; data through 6/30/26
The chart shows the path of the S&P 500 Index in the first half of 2026, with key events noted and explanations of market moves. The S&P 500 Index began the year at 6845.5 and peaked at 6978.6 in late January. After trading roughly sideways for about a month, it then declined in March when the U.S./Israel-Iran war broke out, oil prices surged, and inflation rose. It bottomed on March 30 at 6343.7. Soon after, it began to rise as the market started to embrace the potential for Middle East de-escalation, and it then rallied sharply through early June on AI/semiconductor and overall earnings growth and forecasts; Middle East de-escalation also helped the rally along. The market hit its high for the year so far, and a new-all-time high, of 7609.78 on June 2. Since then, it has experienced a normal pullback following a big rally. It ended June 30 at 7499.4.
A small-cap and midcap renaissance
After years of underperformance, small-cap and midcap indexes surged in the first half for a few main reasons:
- These indexes include semiconductors and other stocks tied to the AI data center buildout, which led the broader market;
- Small-cap consensus earnings growth estimates started to improve and, importantly, 2027 estimates currently outstrip those for the S&P 500; and
- The relatively inexpensive valuations of small caps and midcaps compared to large-cap indexes were finally rewarded by investors.
Strong returns for equity indexes with small caps well in the lead
First-half 2026 total returns of key indexes and styles (includes dividends)
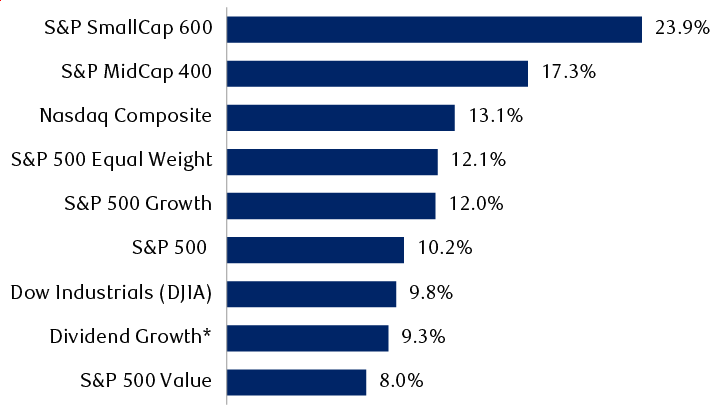
* Dividend Growth based on S&P 500 Dividend Aristocrats Index.
Source - RBC Wealth Management, Bloomberg; data range 12/31/25–6/30/26
The chart compares the performance of nine major U.S. equity indexes and investing styles in the first six months of 2026 based on total return data including dividends. The S&P SmallCap 600 gained 23.9%. The S&P MidCap 400 gained 17.3%. The Nasdaq Composite Index gained 13.1%. The S&P 500 Equal Weight Index gained 12.1%. The S&P 500 Growth Index gained 12.0%. The S&P 500 Index gained 10.2%; The Dow Jones Industrial Average gained 9.8%. The “Dividend Growth” investing style (proxied by the S&P 500 Dividend Aristocrats Index) gained 9.3%. The S&P 500 Value Index gained 8.0%.
Going forward, if domestic economic growth remains sturdy, we think these areas of the market can benefit. Small caps, for example, tend to do well when manufacturing and job growth trends are strong, a pattern RBC economists expect to persist.
However, if interest rates start to rise later this year or next year either due to nagging inflation and/or upward wage pressures, this could constrain small-cap stocks. They tend to lag large caps when the U.S. Federal Reserve becomes hawkish.
Regardless of the near-term outlook, small-cap and midcap positions remain important components of equity portfolios, from our vantage point. Their recent outperformance illustrates the benefits of diversification.
Despite the recent rally, small-cap ownership among institutional investors is still much lower than normal, according to equity futures data. This provides room for such investors to add to positions over time.
“Semi-charmed” performance
Within the large-cap S&P 500, different stocks sat atop the leaderboard in the first half compared to recent years.
Performance previously had been dominated by the Magnificent 7 stocks—Alphabet, Amazon.com, Apple, Meta Platforms, Microsoft, NVIDIA, and Tesla—some of which are AI hyperscalers.
While the top stocks in the first half of 2026 were still tied to the AI theme, the performance leadership mostly flipped from hyperscalers to so-called “picks and shovels”—semiconductors (including memory) and related tech stocks. Nine of the 12 biggest contributors to S&P 500 gains were semiconductor and memory stocks.
All but three of the top contributors to S&P 500 gains were semiconductor stocks
Percentage contribution to the S&P 500’s 10.2% total return in the first half of 2026
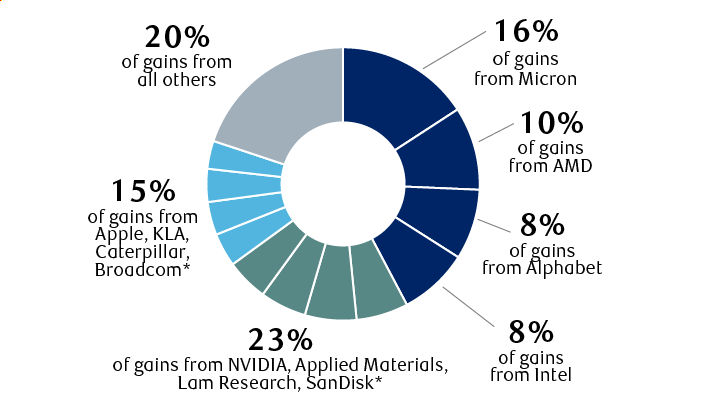
* Stocks listed from largest to smallest contribution.
Source - RBC Wealth Management, FactSet; total return data (includes dividends); data range 12/31/25–6/30/26
The chart shows contributions to the S&P 500’s 10.2% total return in the first half of 2026. Micron Technology contributed 16% of the gains, Advanced Micro Devices (AMD) 10%, Alphabet 8%, and Intel 8% (prior data rounded). A further 23% of the gains were from four stocks: NVIDIA (6.15%), Applied Materials (6.11%), Lam Research (5.48%), and SanDisk (4.98%). Another 15% of the gains were from four other stocks: Apple (3.97%), KLA (3.92%), Caterpillar (3.91%), and Broadcom (3.31%). The other stocks in the index collectively represented 20% of the returns.
This is due to hundreds of billions of dollars being spent on building AI data centers, which are being equipped with advanced chips and other hardware. At the same time, there is limited supply of chips and memory worldwide, so prices of these and related component parts surged—and so did revenues, earnings, and forward consensus estimates.
As a result, the widely followed SOX Index—the Philadelphia Semiconductor Index—rallied just over 100 percent in the first half, with leading memory firm Micron Technology surging an eye-watering 304 percent, chipmaker Advanced Micro Devices advancing 171 percent, and U.S. government-tied Intel jumping 278 percent. These three stocks alone represented a combined 34 percent of S&P 500 gains in the first half.
While we think it’s too early to declare the semiconductor run over due to ongoing AI data center demand amid a global chip shortage and high selling prices, volatility and pullbacks in these stocks should be expected in the months ahead, especially after such a lightning-fast run.
To manage risk, we think investors should be vigilant about single-stock and industry exposures in portfolios by bringing them back to reasonably sized positions if they’ve drifted well out of bounds.
Broadly speaking …
Despite the fact that semiconductor stocks absolutely dominated the S&P 500, performance wasn’t as narrow as it might seem:
- Nine of 11 sectors rose during the period, and a diverse group of five outperformed the S&P 500;
- Industrials led the market;
- Energy performed nearly on par with Technology due to a surge in profit growth and consensus estimates tied to the jump in oil prices because of the Middle East conflict;
- 16 of 25 major industry groups (a level below sectors) rose;
- 62 percent of S&P 500 stocks rose; and
- The average and median S&P 500 stock gains were 13.2 percent and 7.4 percent, respectively, including dividends.
Five diverse sectors outperformed the S&P 500 in the first half of 2026
S&P 500 and sector total returns (including dividends)
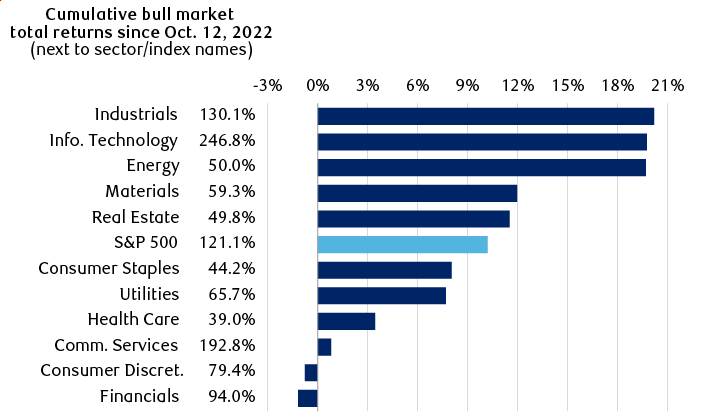
Source - RBC Wealth Management, FactSet; data range 12/31/25–6/30/26
The chart shows S&P 500 and sector total returns in two ways: Return in the first half of 2026, and since the October 12, 2022 low. All data include dividends. The returns are as follows in this order: return in first half of 2026, return since the October 2022 low. S&P 500: +10.21%, +121.1%. Industrials: +20.2%, +130.1%. Information Technology: +19.76%, +246.8%. Energy: +19.69%, +50.0%. Materials: +11.97%, +59.3%. Real Estate: +11.52%, +49.8%. Consumer Staples: +8.03%, +44.2%. Utilities: +7.69%, +65.7%. Health Care: 3.45%, 39.0%. Communication Services: +0.80%, +192.8%. Consumer Discretionary: -0.77%, +79.4%. Financials: -1.18%, +94.0%.
Equal opportunity
The outperformance of the S&P 500 Equal Weight (every stock impacts the movement of the index the same) compared to the capitalization-weighted S&P 500 (the largest stocks impact the movement of the index more) was one of the main first-half surprises. The former rallied 12.1 percent, while the latter rose 10.2 percent.
The reason this occurred is because the 10 largest stocks in the S&P 500 by market cap underperformed significantly as a group. This list includes NVIDIA, Apple, Alphabet, Microsoft, Amazon.com, Broadcom, Meta Platforms, Tesla, Berkshire Hathaway, and JPMorgan Chase.
- The 10 largest stocks rose only 1.14 percent, on average, including dividends;
- Microsoft was the worst performer, dropping 22.5 percent;
- Meta Platforms was next, declining 14.5 percent;
- Tesla was third worst, pulling back 6.5 percent; and
- The best-performing stocks among the 10 largest were Alphabet A shares (+14.3 percent), then NVIDIA (+7.4 percent), and Apple (+6.6 percent).
In recent years, S&P 500 Equal Weight leadership has been fleeting. Its ability to sustain outperformance will likely be determined by whether the 10 largest stocks can bounce back and therefore push the S&P 500 in the lead again.
We think at least a couple of the hyperscalers have the potential to perform better in the near term given their valuations look reasonable and revenue and earnings growth prospects for the rest of this year and next still seem attractive.
Invested, but vigilant
Various market breadth indicators—data that measure the proportion of stocks advancing versus those declining—also confirm that first-half performance wasn’t a one-hit semiconductor wonder as they reached new highs recently.
This normally doesn’t happen when the market has already peaked for the cycle. This development leads us to believe the U.S. bull market, which began in October 2022, has further to go—albeit with some bumps along the way.
While we wouldn’t be surprised if noise surrounding the U.S. midterm elections in November and/or jitters about Fed policy create some waves for the market during the second half of 2026, we suggest maintaining a Market Weight position in U.S. equities.
For more thoughts about our equity and fixed income views for this year and longer-term investment themes, please have a look at recently published Global Insight 2026 Midyear Outlook articles on the web or in PDF format.