

Equity trends remain positive, but interest rates a headwind
In our last Global Insight Weekly technical update on July 23, we noted that while the equity bull market that began in Q4 2022 remained intact, supported by a strong trend in breadth as measured by advance-decline lines, the risk to breadth was likely a move by the U.S. 10-year and 30-year Treasury yields above their 2023–2026 trading ranges heading into the seasonally weak late Q3.
Divergences within the S&P 500
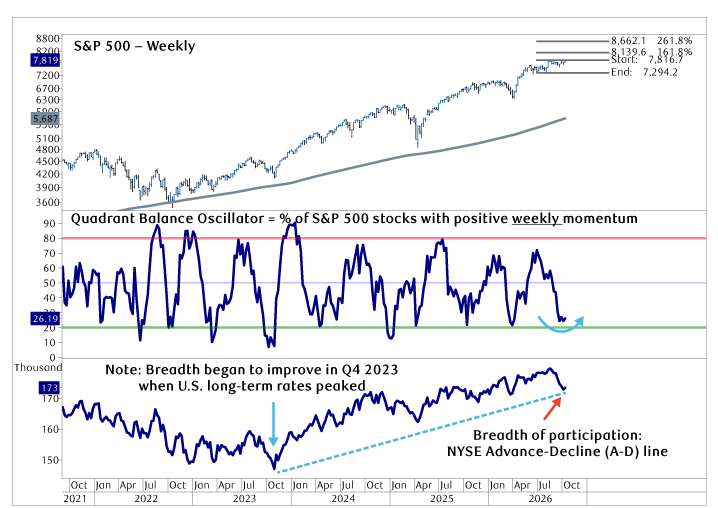
With U.S. long-term interest rates now trending above their 2023–2026 trading ranges, a noteworthy divergence has developed within equity markets. The chart at right shows the S&P 500 Index (top panel) has remained impressively resilient to the rise in interest rates, supported by strength in large-cap growth and Technology stocks, while most other sectors weakened significantly through late summer into early Q4. The NYSE Advance-Decline (AD) line (bottom panel of first chart)—the proportion of stocks moving up versus those moving down—reflects the internal weakness within equity markets, as the recent decline has reversed the 2023–2026 uptrend in response to U.S. long-term rates pushing above their three-year trading ranges.
End of the cycle or just seasonal weakness?
With long-term interest rates marching higher, investors have valid reasons to be more cautious, particularly given the combination of elevated valuations, high market capitalization concentration, ongoing geopolitical instability, and pending uncertainty around the upcoming U.S. midterm elections. While these concerns and many others are legitimate headwinds to the equity bull cycle that began in Q4 2022, we believe there is a technical case that the recent decline in many stocks into late Q3 was temporary in duration, which could set the stage for a rebound in Q4.
S&P 500 with a weekly momentum indicator and NYSE Advance-Decline line
Source - RBC Wealth Management, Bloomberg, Optuma
Becoming oversold heading into Q4?
The weekly Quadrant Balance Indicator (center panel of first chart), tracking the percentage of S&P 500 stocks with rising weekly momentum, has been a useful indicator to track one- to two-quarter swings within equity markets. That indicator has transitioned from overbought (high) levels at the end of Q2 toward oversold (low) levels heading into late Q3 and early Q4. The recent decline through Q3 reflects most stocks in the S&P 500 having either paused or declined over the past few months, consistent with the weakness seen in the NYSE AD line. With the indicator declining toward 20 percent, a reading we consider as oversold (low), we expect a bottom to develop over the coming weeks that should be supportive of a recovery in Q4.
U.S. long-term interest rates test next important technical levels
While upcoming corporate earnings reports will be a catalyst for equities in the coming weeks, a pullback in interest rates will likely be needed to support a meaningful equity rebound, in our view, particularly for more interest-sensitive mid- and smaller-cap indexes. Although we think it is premature to conclude that interest rates are beginning to pull back, both the U.S. 10-year and 30-year Treasury yields are now well advanced above their 2026 uptrends and nearing next technical levels we view to be likely pause levels at 5.35 percent and 5.8 percent to 6.0 percent, respectively. Interestingly, while some interest-sensitive equity groups, such as homebuilders, remain weak, others, such as the Utilities sector, show a noteworthy divergence, displaying early signs of bottoming after a steep decline into the end of Q3.
Semiconductors: New upleg underway or potential cycle peak?
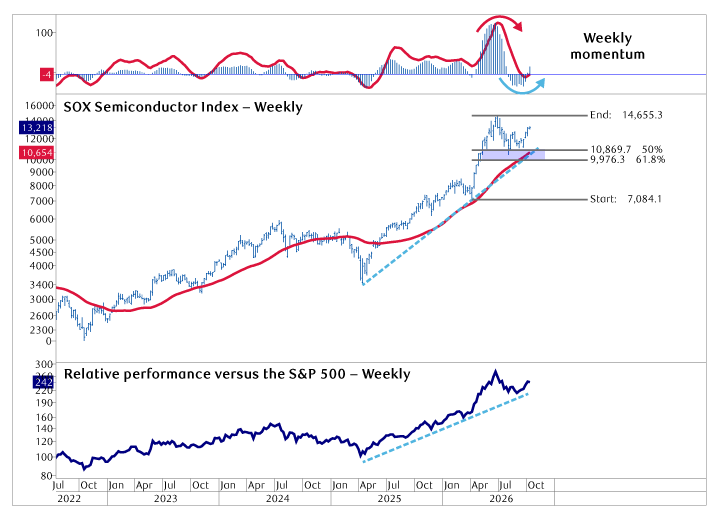
The semiconductor group is arguably the most important one within equity markets, given it often bottoms and peaks ahead of the broader market and well in advance of major changes in its fundamentals. After a 600 percent surge from the Q4 2022 cycle low with over 300 percent of the move developing since Q2 2025, the uptrend for the Philadelphia Semiconductor Index (SOX) appears intact but well advanced, as shown in the chart above. The 29 percent correction in June–July pushed 2–4+ month indicators from overbought levels in June back to oversold levels moving into September, with most semiconductor stocks staging rebounds from important support levels near rising 200-day moving averages.
SOX Semiconductor Index begins an oversold rebound
Source - RBC Wealth Management, Bloomberg, Optuma
We view the current rebound as another legitimate upleg taking hold with potential to make new highs in Q4 2026–Q1 2027. However, what would concern us is if the SOX failed to make new highs and began another downside move. Such a pattern would establish a lower high, which often develops at major cycle peaks, with a break below most recent lows in Q3 needed to confirm that a bear market trend is underway. For this reason, we would encourage investors to remain alert to the technical behavior of the semiconductor group and to consider managing downside risk at the recent lows.