

When you invest in sector-focused products, you might assume that a sector exchange-traded fund (ETF) and its underlying benchmark index are essentially the same thing. After all, both are designed to track the performance of a specific economic sector. However, this assumption can be misleading. While sector ETFs and sector benchmark indexes are closely related, they operate under fundamentally different constraints, most notably the regulated investment company (RIC) rules. Understanding this difference is critical for investors who want to know what they’re actually holding in their ETF and how it might perform relative to their expectations.
What are sector ETFs and benchmark indexes?
Sector benchmark indexes, such as the S&P 500 Communication Services Index or the S&P 500 Information Technology Index, are theoretical constructs. They represent the companies within a particular sector and can be used to gauge returns and risk. Benchmark indexes are not tradable; rather, they are proxies for market segments and act as reference points to measure how a specific sector is performing.
A sector ETF, by contrast, is a real investment product. These ETFs are bought and sold on stock exchanges and aim to replicate the performance of their underlying sector benchmark index.
The RIC rules: Tax efficiency meets portfolio constraints
Most ETFs, including sector-focused ones, elect to be treated as RICs for tax purposes. This designation is important because it allows ETFs to operate as pass-through entities, distributing income and capital gains directly to shareholders without paying tax at the fund level. This structure is one of the reasons ETFs are tax-efficient for investors—it eliminates double taxation.
However, to qualify and maintain RIC status, ETFs must satisfy strict regulatory requirements, including diversification tests known as the 25/5/50 rule. These tests are assessed at the close of each quarter and include:
- The 25 percent cap: No more than 25 percent of total assets can be concentrated in a single issue (excluding government securities or other RICs).
- The 5 percent/50 percent test: Positions exceeding five percent cannot collectively represent more than 50 percent of the fund’s total assets.
Sector benchmark indexes have no such constraints. They can hold whatever concentration levels the index provider deems appropriate based on market data and sector composition. This distinction has real consequences for how sector ETFs are built and how closely they track sector benchmarks. To manage this constraint while maintaining RIC status, ETF providers may adjust holdings to stay within regulatory limits, which may mean underweighting the largest companies in the sector.
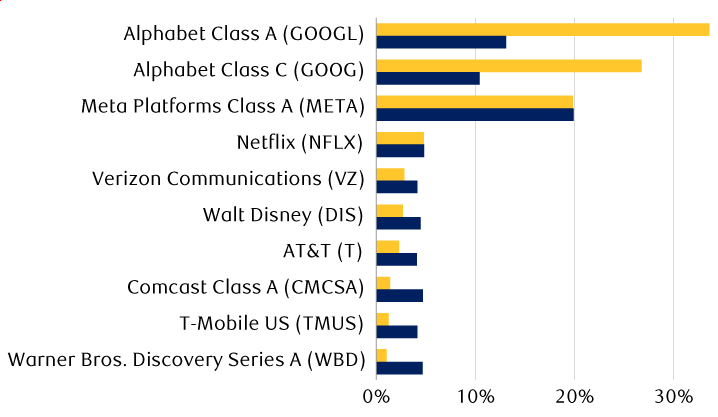
The chart below illustrates this dynamic by comparing the top 10 companies in the S&P 500 Communication Services benchmark against the holdings of the State Street® Communication Services Select Sector SPDR® ETF, and we can see meaningful weighting differences. Most notably, the combined weight of Alphabet’s Class A and Class C shares (treated as a single issuer) is the largest index holding at 60 percent and is significantly underweighted in the ETF at only 23.5 percent. This adjustment keeps the ETF within the RIC diversification requirements while the index faces no such constraint. Smaller positions, such as Verizon and Walt Disney Company, show corresponding overweight allocations within the ETF, demonstrating how RIC compliance can reshape the portfolio.
Regulated investment company rules cap the ETF’s top holdings, altering the fund’s makeup vs. sector index
Top index holdings vs. sector ETF
Source - RBC Wealth Management, FactSet; data as of 6/30/26
The bar chart compares the top holdings of the S&P 500 Communication Services Index versus the State Street® Communication Services Select Sector SPDR® ETF measured by proportion of market capitalization as of June 30, 2026. The sector index weighting is listed first and the ETF weighting is listed second. Alphabet Class A (GOOGL) was 33.6% of the sector index and 13.1% of the ETF. Alphabet Class C (GOOG) was 26.8% and 10.4%. Meta Platforms Class A (META) was 19.8% and 19.9%. Netflix (NFLX) was 4.8% for each. Verizon Communications (VZ) was 2.8% and 4.1%. Walt Disney (DIS) was 2.7% and 4.5%. AT&T (T) was 2.3% and 4.1%. Comcast Class A (CMCSA) was 1.4% and 4.7%. T-Mobile US (TMUS) was 1.3% and 4.2%. Warner Bros. Discovery Series A (WBD) was 1.1% and 4.7%.
Performance implications
These regulatory adjustments can create a tracking difference, or the performance gap between the ETF and its target benchmark. In most cases, this tracking difference is small. However, in concentrated sectors or during periods of significant market movements, the difference can become material.
For instance, if a sector experiences a sharp rally driven primarily by its largest company, the sector ETF constrained by RIC rules might capture less of that gain than the benchmark index. Conversely, if that same company declines sharply, the ETF might suffer less than the benchmark since it was already underweighting that position.
The table demonstrates this principle in real market conditions. Over the first half of 2026, the State Street® Communication Services Select Sector SPDR® ETF underperformed the S&P 500 Communication Services benchmark by nine percent year to date. This underperformance occurred because the index’s top holding, Alphabet, outperformed the broader sector during this period. By maintaining significantly lower weight to this company due to RIC diversification requirements, the ETF couldn’t fully capture gains from the position. While this represents an unfavorable outcome for ETF investors in this particular cycle, it underscores an important reality: RIC constraints don’t always hurt performance, but they do create meaningful deviations from the pure index composition.
Performance gaps can emerge in concentrated sectors when large positions are on the move
| 3M | YTD | 1Y | 3Y | |
|---|---|---|---|---|
| State Street® Communication Services Select Sector SPDR® ETF (XLC) | -3.1% | -8.4% | 0.0% | 19.4% |
| S&P 500 Communication Services Index | 8.3% | 0.8% | 21.1% | 29.2% |
| Tracking difference | -11.4% | -9.2% | -21.1% | -9.8% |
Source - RBC Wealth Management, Morningstar; returns as of 6/30/26
Many sector benchmark indexes are designed by providers with RIC considerations in mind. Index methodologies often include concentration limits to ensure that the theoretical index itself remains within reasonable boundaries for ETF tracking. This approach minimizes the gap between the index and compliant ETF products.
The regulatory framework underlying ETFs isn’t glamorous, but it is an essential infrastructure that protects tax efficiency while maintaining market integrity. Understanding how RIC rules shape your sector ETF investments gives you a deeper, more informed perspective on what you own and how it might diverge from market benchmarks.