A volatile year for the greenback
After a sharp slide in H1 2025, the greenback has settled into a narrower trading range since July as foreign demand for U.S. assets was more resilient than expected. Earlier concerns about widespread capital outflows following the Trump administration’s tariff salvo in April have, so far, not materialized.
However, the magnitude of the dollar’s earlier weakness warrants some context. The roughly 10% drop in the U.S. Dollar Index (DXY) through midyear 2025—an outsized move for a major currency—essentially unwound the strong late-2024 rally, when optimism surrounding U.S. growth prospects ahead of and following the November elections briefly lifted the greenback.
An election-related rally followed by a bigger selloff
U.S. Dollar Index (DXY)
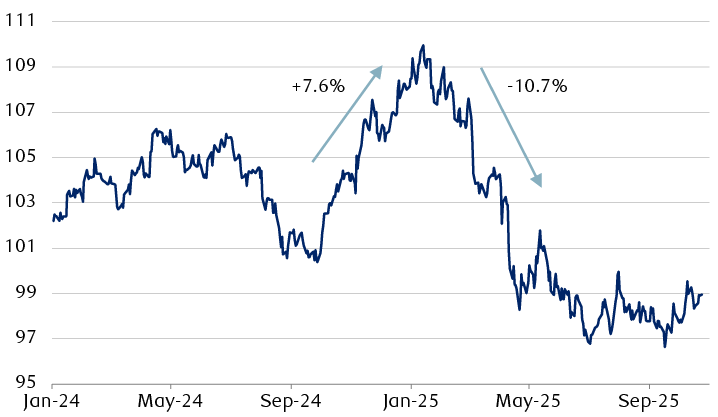
Source - RBC Wealth Management, Bloomberg; daily data through 10/24/25
The line chart shows the U.S. Dollar Index since 2024. The index rose by 7.6% in Q4 2024 followed by a 10.7% decline in the first half of 2025.
Zoom out for cycles
Viewed through a longer lens, the U.S. dollar tends to move in prolonged regimes lasting around seven to 10 years. Historically, strong dollar cycles have generated average gains of roughly 65%, while weak dollar phases have seen average declines of around 40%. Whether the latest long-running bull cycle—which began in early 2008—peaked in September 2022 remains to be seen. Since that point, the DXY has fallen about 13%, suggesting to us that the currency may be transitioning into a new phase.
A new phase?
U.S. Dollar Index (DXY)
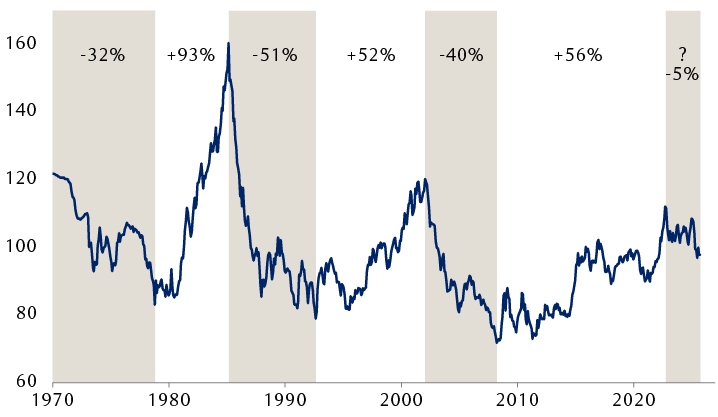
Shaded regions indicate U.S. dollar bear cycles.
Source - RBC Wealth Management, Bloomberg; monthly data through 9/30/25
The line chart shows the U.S. Dollar Index since 1970, highlighting rising (bullish) and falling (bearish) phases (listed in the table below).
In the near term, cyclical forces—relative growth momentum, interest rate differentials (the difference between U.S. rates and those of other large, advanced economies), and the ebb and flow of U.S. policy uncertainty—will likely continue to shape the dollar’s direction over the next six to 12 months. Political unpredictability, such as abrupt trade-policy changes, can erode confidence in the greenback, as seen earlier this year.
Over the long run, however, starting valuations tend to exert greater influence. Even after this year’s depreciation, RBC Global Asset Management estimates that the U.S. dollar remains notably overvalued relative to major peers. Although valuations have limited sway on short-term market moves, they tend to anchor long-term outcomes, suggesting to us that the dollar may face a more challenging multi-year outlook.
Currency purchasing power parity valuation
October 2025
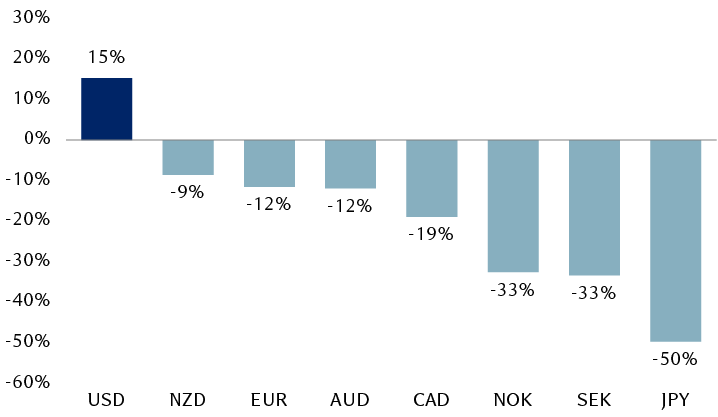
USD valuation calculated relative to other countries using weights from the U.S. Trade-Weighted Advanced Foreign Economies (AFE) Dollar Index.
Source - RBC Global Asset Management
The column chart shows estimated valuation levels for select major currencies in terms of purchasing power parity. The U.S. dollar is valued at +15%, the New Zealand dollar at -9%, the euro and Australian dollar at -12%, the Canadian dollar at -19%, the Norwegian krone and Swedish krona at -33%, and the Japanese yen at -50%.
Implications for global equities
A durable turn in the U.S. dollar’s structural trend would likely be a more conducive environment for equity markets outside the United States. The table below illustrates historical dollar bull and bear cycles since Dec. 31, 1969, underscoring how the dollar’s direction can be a meaningful driver of equity market leadership patterns.
Periods of broad dollar strength have typically aligned with U.S. equity outperformance. Conversely, during extended stretches of dollar weakness—such as those observed between 1970 and 1978, 1985 and 1992, plus 2002 and 2008—equity markets outside the U.S. have tended to perform well or take the lead.
U.S. dollar cycles
Since December 31, 1969
| Cycle | Duration (years) | U.S. Dollar Index (DXY) | S&P 500 | MSCI World ex USA Index | ||||
|---|---|---|---|---|---|---|---|---|
| Start | End | Cum. | Ann. | Cum. | Ann. | Cum. | Ann. | |
| Dec 1969 | Oct 1978 | 8.8 | -31.8% | -4.2% | 43.3% | 4.2% | 85.3% | 7.2% |
| Oct 1978 | Feb 1985 | 6.3 | 93.1% | 10.9% | 168.8% | 16.9% | 34.7% | 4.8% |
| Feb 1985 | Aug 1992 | 7.5 | -50.8% | -9.0% | 196.1% | 15.6% | 207.2% | 16.1% |
| Aug 1992 | Jan 2002 | 9.4 | 52.4% | 4.6% | 228.1% | 13.4% | 58.8% | 5.0% |
| Jan 2002 | Mar 2008 | 6.2 | -40.3% | -8.0% | 31.0% | 4.5% | 126.7% | 14.2% |
| Mar 2008 | Sep 2022 | 14.5 | 56.1% | 3.1% | 263.5% | 9.3% | 35.2% | 2.1% |
| Sep 2022 | Sep 2025 | ? | -12.8% | -4.5% | 94.9% | 24.9% | 83.1% | 22.3% |
| Bull cycle (average) | 10.1 | 67.2% | 6.2% | 220.2% | 13.2% | 42.9% | 4.0% | |
| Bear cycle (average) | 7.5 | -41.0% | -7.1% | 90.1% | 8.1% | 139.7% | 12.5% | |
Index performance: Cum. = cumulative; Ann. = annualized. Equity performance reflects total returns.
Source - RBC Wealth Management, Bloomberg; data through 9/30/25
Currency diversification
Over the past decade, persistent dollar strength has enhanced U.S. equity returns in foreign-currency terms while dampening global ex-U.S. equity performance when measured in dollars. If the U.S. dollar is transitioning to a secular weakening phase, those dynamics could reverse—turning a longstanding headwind into a tailwind for globally diversified portfolios.
Recent market behaviour underscores this point: Broad-based dollar weakness in H1 2025 lifted the MSCI World ex USA Index to a 19.5% total return, compared to the S&P 500’s 6.2% advance over the same period.
Even within a structural downtrend, however, the U.S. dollar’s path is unlikely to be linear. Periodic shifts in relative growth and interest rate differentials between the U.S. and other economies can still generate countertrend rallies. Meanwhile, the dollar’s unique reserve-currency status should continue to underpin steady demand that could at times support its value beyond what fundamentals imply.
Nevertheless, valuations remain an important guidepost for assessing long-term expectations. In our view, the combination of the U.S. dollar starting from a position of broad overvaluation and the elevated weight of U.S. assets in many portfolios reinforces the strategic merit for maintaining meaningful allocations to global ex-U.S. equities.
Foreign exchange regime shifts can introduce uncertainty—but also opportunity. For long-term investors, a trend transition toward dollar weakness could reopen a window for global equity diversification to reassert its value as a source of both return potential and currency diversification.