The mantra was “recession, recession, recession” when 2023 began. Following a difficult year in 2022 when the S&P 500 declined 18 percent, many economists forecast the U.S. economy would succumb to recession in 2023 due to the Fed’s very aggressive rate hike cycle, and market strategists thought this could prolong the pain for stocks.
A recession has yet to pan out, large technology stocks took off, and the S&P 500 ended up posting strong 24.2 percent gains for the year (26.3 percent including dividends)—well above the 10.3 percent average annual price return since 1980.
But we think there’s more to the 2023 story than recession avoidance. Five catalysts pushed U.S. stocks higher, and some interesting details can be found in our charts.
2023 was a volatile yet strong year for the S&P 500 Index
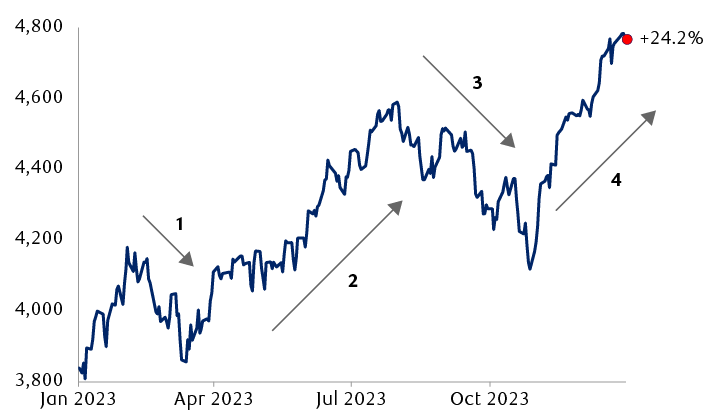
- Stocks decline as Treasury yields climb and inflation remains high. Regional bank crisis hits in March.
- Stocks rally as regional bank stress starts to lift. Treasury yields pull back and the inflation rate declines notably.
- Stocks decline as Treasury yields surge and 10-year yield reaches 4.99% in October. Government shutdown fears add fuel to the selloff.
- Stocks rally in anticipation of Fed rate cuts in 2024 and the Fed gets dovish, and also as yields and inflation decline and soft-landing sentiment rises.
Line chart showing the path of the S&P 500 Index in 2023 with text labels describing the declines and rallies during the year. The market initially rose from 3,839 when the year began to 4,179 in early February. Then it began to decline as Treasury yields climb and inflation remains hot. Regional bank crisis hits in March. Then stocks rallied as regional bank stress starts to lift. Treasury yields pull back and the inflation rate declines notably. This pushed the market up to 4,588 in late July. The market then started to sell off as Treasury yields surge and 10-year yield reaches 4.99% in October. Government shutdown fears add fuel to the selloff. The market declined to 4,177 in late October. The market then rallied in anticipation of Fed rate cuts in 2024 the Fed gets dovish; also as yields and inflation decline and soft-landing sentiment increases. The S&P 500 finished the year at 4,769.83, up 24.2%.
Source - RBC Wealth Management, Bloomberg; daily data through 12/31/23. 24.2% return does not include dividends; return with dividends is 26.3%.
The “Big 7” AI-themed stocks dominated, but performance broadened out in Q4
The group of stocks commonly referred to as the “Magnificent 7” or “Big 7” trounced the rest of the U.S. equity market in 2023, rising 105 percent on average. This group includes Apple, Microsoft, Alphabet, Amazon.com, NVIDIA, Tesla, and Meta Platforms.
These are very different companies, but they all have benefited from artificial intelligence (AI) trends (and hype), a transformative technology they incorporate into their business models in one way or another. (For more on AI, see this article.)
During the first nine months of the year, the Big 7 stocks accounted for about 75 percent of the S&P 500’s gains. They represent 26 percent of S&P 500 market capitalization, so whether they trade up or down is a major factor in shaping this large-cap index’s performance.
The Big 7’s outsized gains are also a key reason why the Nasdaq Composite rallied 43.4 percent in 2023 (44.6 percent including dividends), as these stocks trade on the Nasdaq exchange.
The good news is that market performance began to broaden out beyond the Big 7 in Q4. In addition to the Information Technology sector, the Real Estate, Consumer Discretionary, Financials, and Industrials sectors outperformed the S&P 500 on a total-return basis from late October to year end.
“Big 7” not so big on a 2-year basis
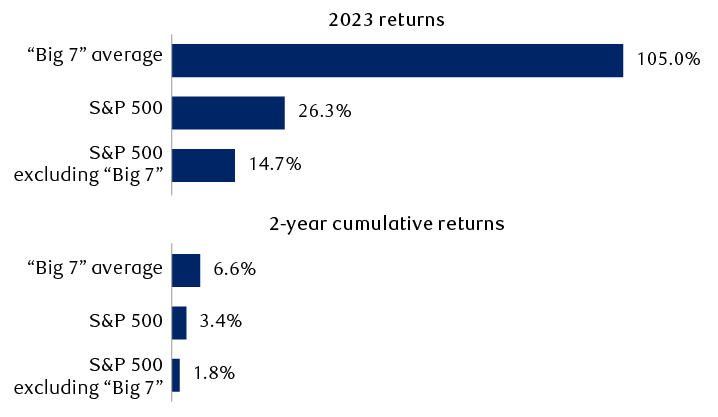
Bar chart showing returns in 2023 and for the past two years cumulative for three categories. 2023 returns: "Big 7" average 105.0%, S&P 500 26.3%, S&P 500 excluding "Big 7" 14.7%. 2-year cumulative returns: "Big 7" average 6.6%, S&P 500 3.4%, S&P 500 excluding "Big 7" 1.8%.
Note: “Big 7” stocks represent Apple, Microsoft, Alphabet, Amazon.com, NVIDIA, Tesla, and Meta Platforms.
Source - RBC Wealth Management, FactSet; data through 12/31/23, data represents total returns (includes dividends)
The Fed’s pivot played a key role
The Fed’s dramatic change in stance—pivoting from one of the most aggressive rate hike cycles in history to forecasting multiple rate cuts for 2024—boosted the equity market in Q4 and we think it was one of the key reasons that sector performance broadened out.
Not only did other large-cap sectors participate, but small-cap and midcap indexes also rallied strongly in late 2023. The S&P Small Cap 600 and S&P MidCap 400 surged 23.9 percent and 20.0 percent, respectively, from late October to year end. Even dividend growth stocks, which had lagged badly for much of 2023, rose 14.1 percent during the same period as measured by the S&P 500 Dividend Aristocrats Total Return Index.
Most U.S. major indexes and styles posted above-average returns in 2023
Full-year total returns of key indexes and styles (includes dividends)
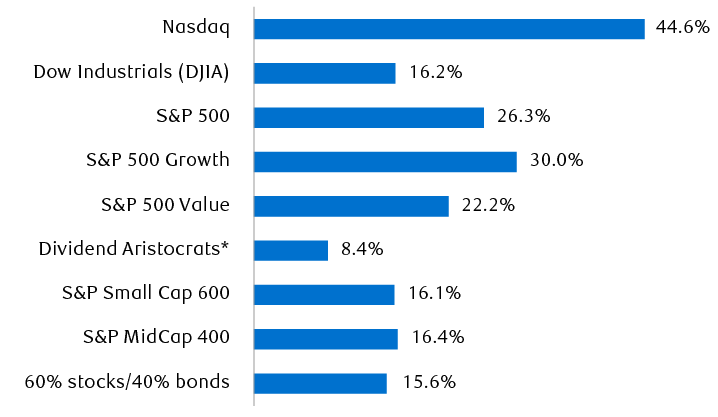
Line chart represents nine major U.S. indexes and styles showing performance for 2023 based on total return data (includes dividends). Nasdaq +44.6%; Dow Jones Industrial Average +16.2%; S&P 500 +26.3%; S&P 500 Growth +30.0%; S&P 500 Value +22.2%; Dividend Growth (S&P 500 Dividend Aristocrats Index) +8.4%; S&P Small Cap 600 +16.1%; S&P MidCap 400 +16.4%; 60% stocks/40% bonds +15.6%.
* S&P 500 Dividend Aristocrats Index (total return)
Source - RBC Wealth Management, Bloomberg; data through 12/31/23
Declining inflation and Treasury yields, stronger-than-expected GDP, and soft-landing sentiment helped
The consumer inflation rate dropped from 7.5 percent at the start of the year to 3.1 percent in November (December data will be released soon). Treasury yields surged midyear with the 10-year yield peaking at 4.99 percent in October, but it quickly fell back to 3.88 percent by year end—just slightly above where it started the year—as the Fed became more dovish and additional rate cuts were factored into bond market expectations. And economists’ consensus forecast for 2023 GDP growth rose from just 0.3 percent in January 2023 to 2.40 percent by year end.
These major changes, combined with the labor market’s resiliency, led market participants to become more optimistic that a soft landing is possible.
The market surged despite low earnings growth
S&P 500 earnings for the first three quarters of 2023 declined 1.6 percent compared to the first three quarters of 2022. While Q4 earnings have yet to be reported, the consensus forecast is for growth to exceed the year-ago period handily, and if it does, we think full-year 2023 earnings growth will rise at least 4.0 percent year over year once the earnings surprises are factored in.
How could the market rally so strongly in 2023 amid tepid, below-average earnings growth? Typically over short periods of time, the magnitude of market gains and earnings growth are not tightly correlated. But over the long term, the relationship between the two is tighter.
We think market participants began to look ahead in anticipation of stronger earnings gains in 2024, which is another reason the broader market rallied toward year end. For this stronger earnings scenario to play out, the economy would need to deliver some decent growth with a healthy soft landing, in our view.
The regional bank crisis came and went
The collapse of Silicon Valley Bank and other troubled regional banks sparked a crisis in March, capturing the attention of investors worldwide. But the crisis came and went, and as the regional banking system stabilized, this group of stocks slowly stabilized and then improved.
And as the Fed pivoted toward a dovish stance and soft-landing sentiment rose, the S&P 500 Regional Banks Index rallied 34.9 percent from late October through year end, clawing back part of the year’s losses.
Hold your ground
Some of our charts clearly illustrate that 2023 was largely a reversal of poor 2022 performance.
For some sectors, 2022 and 2023 returns were nearly a mirror image of each other
S&P 500 and sector total returns (including dividends)
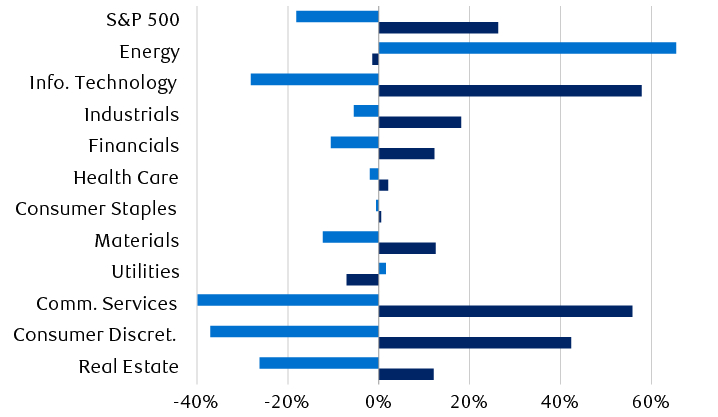
Bar chart showing S&P 500 and sector total returns in three ways: Cumulative 2-year return, and 2022 and 2023 annual returns. All data include dividends. The bars for the 2022 and 2023 returns illustrate that for some sectors, there was a wide difference in performance during the two years. The returns are as follows in this order: Cumulative 2-year, 2022, and 2023. S&P 500: +3.37%, -18.13%, +26.26%. Energy +63.08%, -1.42%, +65.43%. Information Technology +13.34%, -28.19%, +57.84%. Industrials +11.57%, -5.51%, 18.08%. Financials +0.25%, -10.57%, +12.27%. Health Care +0.06%, -1.95%, +2.06%. Consumer Staples -0.11%, -0.62%, +0.52%. Materials -1.27%, -12.28%, +12.55%. Utilities -5.63%, +1.56%, -7.08%. Communication Services -6.34%, -39.89%, 55.80%. Real Estate -17.15%, -26.21%, 12.10%.
| Sector | 2023 | 2022 | Cumulative 2-year total return |
|---|---|---|---|
| Real Estate | 12.10% | -26.21% | -17.15% |
| Consumer Discretionary | 42.30% | -37.03% | -10.39% |
| Communication Services | 55.80% | -39.89% | -6.34% |
| Utilities | -7.08% | 1.56% | -5.63% |
| Materials | 12.55% | -12.28% | -1.27% |
| Consumer Staples | 0.52% | -0.62% | -0.11% |
| Health Care | 2.06% | -1.95% | 0.06% |
| Financials | 12.27% | -10.57% | 0.25% |
| Industrials | 18.08% | -5.51% | 11.57% |
| Information Technology | 57.84% | -28.19% | 13.34% |
| Energy | -1.42% | 65.43% | 63.08% |
| S&P 500 | 26.26% | -18.13% | 3.37% |
Source - RBC Wealth Management, Bloomberg; data through 12/31/23
We think equity returns in 2024 will mainly depend on whether the U.S. economy succumbs to recession or achieves a much-coveted soft landing. The year-end rally seems to be indicating the latter scenario, but we believe there are lingering risks that the lagged effect of the Fed’s aggressive rate hike campaign could at the very least dampen U.S. consumer spending and GDP growth in the quarters ahead.
We would maintain Market Weight positioning in equities overall, which attempts to balance the risks of a U.S. recession against the possibility that one may again be averted. We recommend tilting portfolios toward higher-quality segments of the equity market, including those companies with resilient balance sheets, sustainable dividends, and reliable cash flow generation.