The relationship between a bond’s tenor and yield is typically positive—longer maturities have higher yields. This makes intuitive sense; longer time frames are associated with greater uncertainty, which has historically earned investors a premium. Because bond market participants are not the most creative bunch, this baseline condition of higher yields for longer maturities is referred to as a “normal” yield curve.
Sometimes, however, the typical relationship is inverted, and shorter maturities command a yield premium, a circumstance that is—predictably, if unimaginatively—called an “inverted” yield curve. There are many ways to define “short” and “long” maturities when looking at bonds, but one of the most common is comparing the 2-year and 10-year Treasury rates. By that measure, the curve is currently inverted by 45 basis points, with 2-year yields of 4.87 percent and 10-year yields of 4.42 percent.
More significant than the size of the current inversion is its duration—it’s been nearly two years since normalcy prevailed in the yield curve, exceeding the prior record of 623 days set back in 1978 and dwarfing the average 92-day inversion of the past half century.
Yield curve inversion: Not large, but durable
Difference between 10-year and 2-year U.S. Treasury yields
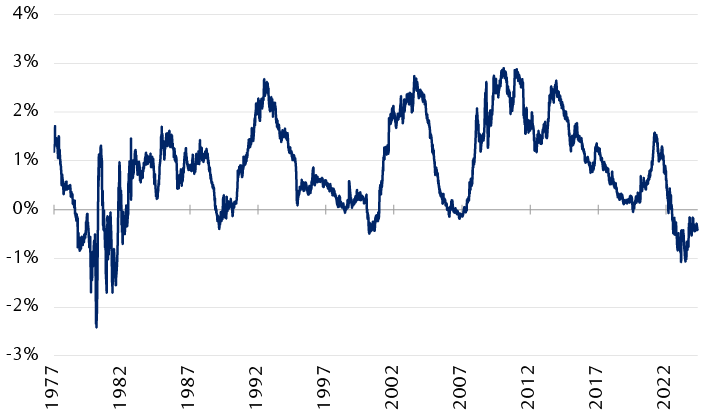
The line chart shows the difference between the 2-year and 10-year U.S. Treasury bond yields (aka the 2Y/10Y yield curve) since 1977. Negative values represent an “inversion” of the yield curve. The current inversion began in July 2022 and reached a maximum of roughly -1% in mid-2023. The largest inversion shown reached roughly -2.4% in 1980. The current inversion is the longest continuous period of negative values in 50 years.
Source - RBC Wealth Management, Bloomberg
Curve inversions as a recession indicator
Curve inversions are watched closely as recession predictors, and there are two paths to connect economic slowdowns with yield differentials.
The first is that inversions reflect excessively tight monetary policy. Under this view, restrictive monetary policy causes growth to slow, which in turn prompts the Fed to lower rates. These cuts can hurt investors in shorter-maturity bonds as they are forced to reinvest at these lower future rates. This rollover risk makes longer-maturity bonds more attractive, pushing prices up and yields down on 10-year bonds.
The second connection between inverted yield curves and slowing economic activity stems from cross-asset class performance. In a slowing economic environment, growth-sensitive assets such as stocks can face headwinds, while fixed income offers investors a more stable set of cash flows.
Shifting thinking on inversion drivers
Both explanations, we believe, have played a role during the current inversion. To varying degrees, private and public sector forecasters have seen elevated risks of a recession in the past two years, making longer maturities more attractive. Investors have also had at times quite aggressive forecasts for Fed rate cuts, most notably at the end of last year and beginning of this year.
Neither seems particularly relevant at the moment, however. Equity prices are at or near record highs while growth-sensitive commodities are showing very strong year-to-date performance. Copper, for instance, is up nearly 25 percent in 2024. This type of performance, we believe, is inconsistent with the idea that investors are expecting a near-term recession or meaningful growth slowdown.
Commodities and equity signals seem to diverge from the yield curve
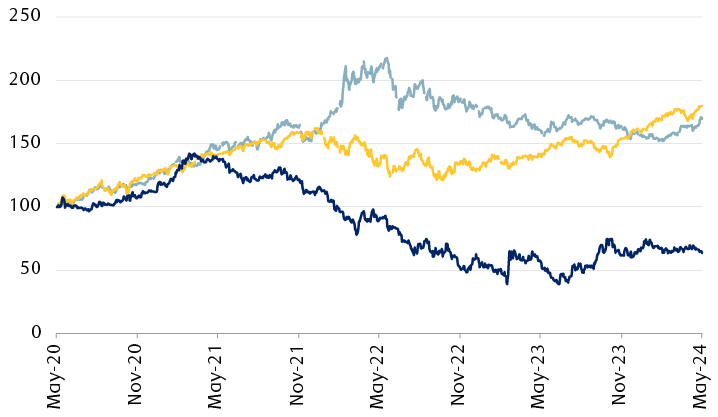
The line chart shows the performance of the Bloomberg Commodity Index, the S&P 500 Index, and the 2-year/10-year U.S. Treasury yield differential since 2020, all normalized to a level of 100 in May 2020. The commodity and equity indexes have moved higher, while the Treasury differential remains below its May 2020 level.
Performance normalized to 5/22/20 = 100.
Source - RBC Wealth Management, Bloomberg
On the monetary policy side, back in January of this year interest rate futures were pricing in six rate cuts. That made the path to curve normalization quite simple—the Fed was going to do all the work and get shorter-maturity yields below long-maturity yields.
That math, however, no longer works as well. RBC Capital Markets is projecting only three rate cuts this cycle, for instance, and multiple Fed members have already highlighted the prospect that this rate cut cycle will leave rates higher than their post-global financial crisis norm. If correct, short-term rates may not fall enough to allow for an easy curve normalization.
Not normal, not necessarily wrong
Against these market signals of stronger growth and higher-for-longer short-term rates, we would typically expect 10-year rates to rise, re-establishing the typical relationship between longer maturities and higher yields. That hasn’t happened yet. Nor will it any time soon if current bond prices are to be believed. The existing yield-maturity dynamic implies roughly another two years of inversion in the 2Y/10Y relationship.
One reason, in our view, is the relatively high absolute level of bond yields. High-quality corporate bond indexes yield north of 5.7 percent, while some municipal bonds offer tax-equivalent yields of nearly 7.5 percent, depending on an investor’s tax status. For those who take a longer-term perspective, securing that type of yield can be attractive, particularly from a portion of the portfolio that is often considered mere ballast for equities.
Adding to the level of yield is the potential asymmetric risks of owning longer-maturity bonds. Recent Fed commentary has emphasized the high hurdle for the central bank to resume rate hikes, while inflation is driven by an increasingly narrow set of components. At the same time, labor market data has shown some initial cracks. This comes as lower-income households have run down savings and run up debt, leaving them heavily reliant on wage income. The combination of downside risks to growth and a Fed that is reluctant to hike could be a tailwind for longer-term bond prices.
Risks around inflation and policy remain, and we do not want to suggest there is no risk to owning bonds—there is risk at every maturity available. We believe, however, that investors could reasonably view the combination of today’s higher yields and the trends in economic data to conclude that longer-term bonds may deserve a price premium.
One final implication of the inverted yield curve, we believe, is that it gives meaningful comfort that the U.S. will be able to fund its budget deficits for the immediate future. Right or wrong, investors are currently paying a premium to lend to the U.S. for a longer time. That bodes well for the market’s ability to absorb the large amounts of bonds the U.S. plans to sell.
Back to the future?
We believe the current inversion boils down to two realities: economic uncertainty remains high, and short-end rates are either set by or heavily influenced by a government institution while longer-term yields are set by the market. That combination can and, in our view, has led to the disruption of previously durable historical relationships, as the Fed focuses on relatively few short-term factors and the market prices in a wide range of longer-term scenarios. However, we think investors will (eventually) return to their typical behavior of demanding higher yields for longer maturities, and the yield curve will normalize.