
Better confidence that inflation is on track to stabilize near the 2% target and mounting signs that labour market conditions have reached greater balance have allowed the Federal Reserve to clearly signal that rate cuts are coming. Accordingly, markets widely expect the Fed to deliver a 25 basis point (bps) cut in September and have priced in another roughly 175 bps of cuts through June 2025, which would lower the top end of the policy rate to 3.50% from 5.50% over the next 10 months.
Whether this generous dose of monetary easing that markets are anticipating comes to pass depends partly on incoming inflation and economic data. Historically, rate cuts exceeding 150 bps year over year are uncommon outside of recessionary periods. Despite a weak jobs report in early August, most of the data since then—including inflation, income, and consumer spending—suggests that the U.S. economy is shifting into a slower but steady growth trend. Notably, solid wage gains, which have been outpacing inflation since Q1 2023, should help reinforce household spending that contributes roughly 70% of the U.S. GDP. The Atlanta Fed’s GDPNow model is currently tracking 2.0% for U.S. real GDP growth in Q3 2024, roughly in line with the average for the first two quarters of this year.
Markets expect a steady rhythm of rate cuts
Historical U.S. interest rate and market expectations
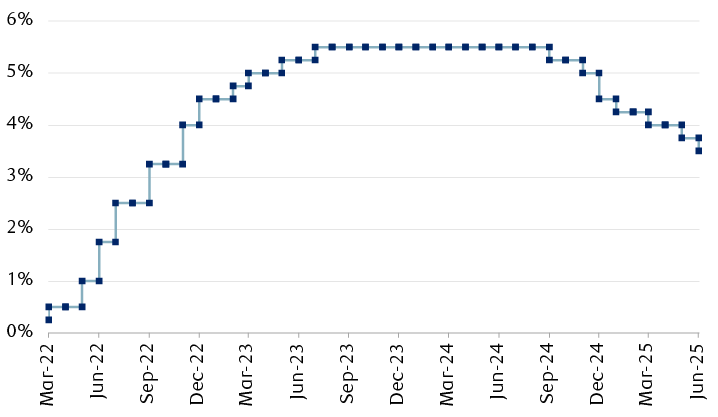
The line chart shows the U.S. policy interest rate from March 2022 through August 2024, and market expectations for the rate through July 2025. After rising from 0.25% in March 2022 to 5.50% in July 2023, the rate has remained steady. Market pricing of federal fund futures as of August 2024 shows an expectation that the rate will begin to fall in September 2024 and reach 3.50% by July 2025.
Source - RBC Wealth Management, Bloomberg; data through 8/26/24; market interest rate expectations based on federal fund futures.
Equities after the first rate cut
In the eleven instances of Fed easing cycles that we identified since 1970, the S&P 500 has often delivered positive returns in the 12 months following the initial rate cut, with a median price return of 11.9%. However, the macro context behind monetary easing matters a great deal, which is why outcomes around these policy turning points vary so widely.
S&P 500 Index performance after the start of rate cutting cycles
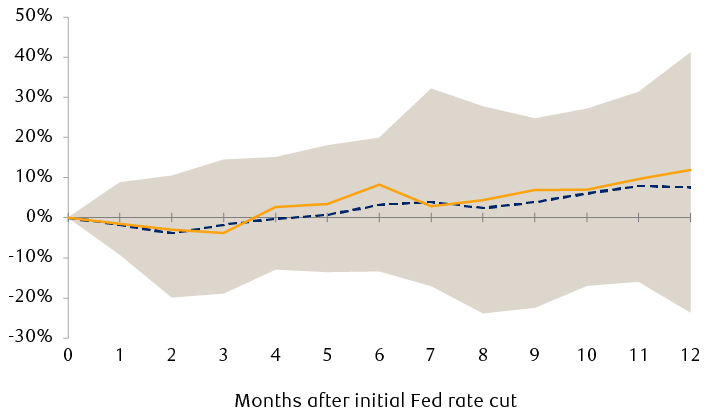
The line chart shows the monthly change in the S&P 500 Index over the 12 months following the start of U.S. interest rate cutting cycles since 1970. The index rose by an average of 7.6% over 12 months, with a median increase of 11.9%. Twelve-month performance covered a range of positive and negative changes, from a 41% rise to a 24% decline.
Shaded areas represent the range of historical performance after the first Fed interest rate cut.
Source - RBC Wealth Management, Bloomberg; S&P 500 data since 1970
In cycles where rate cuts were able to prolong economic expansion and keep corporate earnings on an upward trend, equities have tended to perform quite well. However, in cycles where monetary stimulus was unable to prevent an economic downturn, equities have typically recorded losses in the 12 months after rate cuts began as corporate profits come under pressure.
Beyond that, every Fed easing cycle is different, so starting conditions likely have some influence as well. If the Fed begins the rate cut cycle in September, it could be doing so at a time when the S&P 500 is near all-time highs, with elevated valuations, and just two months before a presidential election. On the flip side, the recent run of economic data broadly suggests the U.S. economy is on a reasonably firm footing, which, if sustained, should bode well for corporate profit growth to remain a tailwind for equities in the coming quarters.
Bonds after the first rate cut
In the nine instances of Fed easing cycles that we identified since 1980 for which bond index returns data is available, we found that the performance of high-quality bonds around these transition points to monetary loosening has historically been more consistent. While the upside in bonds is more moderate compared to equities, with a median total return of 7.9% in the 12 months after the first Fed rate cut (see chart, lower right), the performance patterns for bonds through these periods lean more positively, with fewer instances of negative returns for high-quality bonds.
Bloomberg U.S. Aggregate Bond Index performance after the start of rate cutting cycles
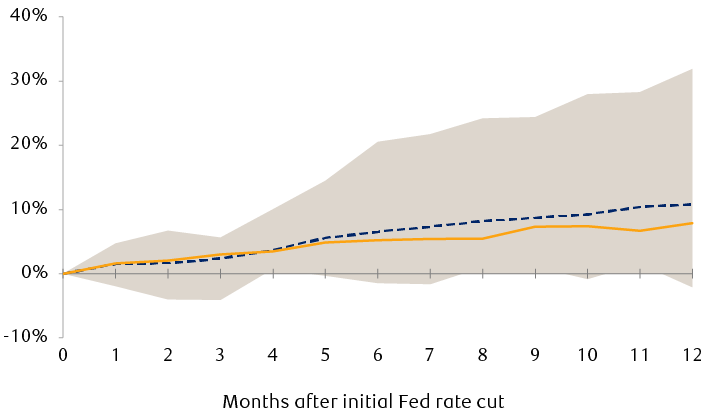
The line chart shows the monthly change in the Bloomberg U.S. Aggregate Bond Index over the 12 months following the start of U.S. interest rate cutting cycles since 1980. The index rose by an average of 10.8% over 12 months, with a median increase of 7.9%. Twelve-month performance was generally positive, ranging from a 32% rise to a 2% decline.
Shaded areas represent the range of historical performance after the first Fed interest rate cut.
Source - RBC Wealth Management, Bloomberg; bond index data since 1980
From a relative standpoint, bonds meaningfully outperformed the S&P 500 in three of these nine rate-cut cycles (1981, 2001, and 2007), coinciding with U.S. recessions and equity bear markets. On a median and average basis, bonds underperformed the S&P 500 by 0.4% and 4.2% in the 12 months after the start of rate cuts.
Nuance and quality
The usual caveats with these types of analysis apply here—no cycles are completely alike, and there is a small sample size. Navigating the pivot to monetary easing requires investors to delve into the different economic settings behind each cycle, which are more relevant in shaping market trajectories. For now, the balance of evidence aligns with market expectations of a “soft landing,” where the economy remains resilient, inflation steadies near target levels, and the Fed implements rate cuts. This backdrop, characterized by ongoing economic growth coupled with lower rates, tends to be a productive setup for both stocks and bonds.
In the near term, the precise number of rate cuts may be less important than the visibility that interest rates are heading lower. Beyond that, we believe recent conflicting messages about the strength of the U.S. labour market merit close attention. Distinguishing between an economy that is experiencing a mid-cycle slowdown and one gradually slipping into recession is tricky in real time.
Given that valuations across asset classes appear to reflect a “soft landing” as the base case, we believe quality remains a worthwhile theme in portfolios. In equities, this can be achieved by emphasizing companies with strong fundamentals better positioned to withstand a slower economy. In fixed income, favouring higher-quality corporate and government bonds, along with extending duration, can help enhance defensive qualities that can benefit portfolios during periods of market volatility.