In our last technical update on March 27, we noted that equity markets disliked uncertainty, and with no shortage of uncertainty at that time and equity markets weakening, we highlighted the potential for a Q2 rebound. While we had not anticipated the dramatic tariff announcements in April and the subsequent violent market reaction, the technical backdrop continued to support a rebound in Q2 into Q3.
Why? The weekly momentum indicators we follow to track 2–4+ month market swings had moved into suitably oversold (low) levels that often support a multi-month equity market rebound. In addition, a variety of technical indicators that many market participants follow, such as the CBOE Volatility Index, Put-Call ratios, AAII Sentiment readings, and the percentage of stocks above their 200-day moving average, had also moved to extreme levels that usually coincide with an equity rebound.
Now what? The indicators mentioned above all bottomed by mid-late April and continue to build positively moving into June with potential to move higher in early-mid Q3. We believe the weekly momentum indicator in the top panel of the first chart, for example, is unlikely to move back to overbought (high) levels until Q3. In contrast to our expectation in Q1 for stocks to rebound from oversold levels around earnings reports in Q2, Q3 could prove to be more challenging as many of the technical indicators highlighted are likely to move back to overbought levels heading into earnings reports in Q3. Interestingly, the S&P 500 is currently tracking the path that it has often followed during the first year of a new U.S. administration with Q1 being weak or volatile followed by a rally that peaks mid Q3 with weakness into Q4.
S&P 500 with weekly momentum (top panel) and advance-decline line (bottom panel)
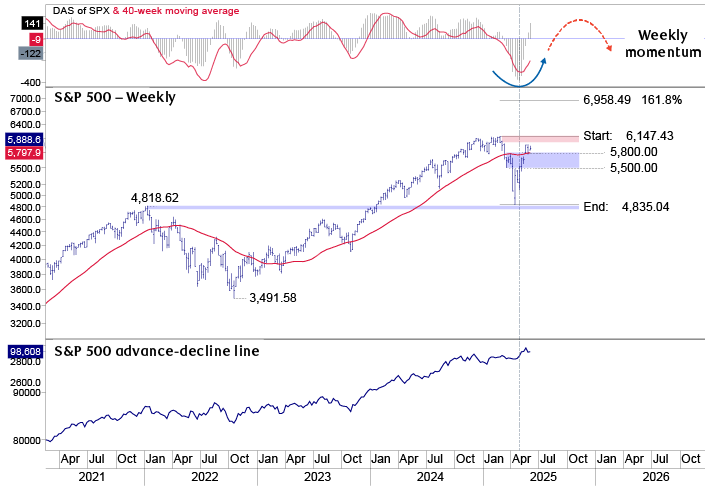
The line chart shows technical indicators of S&P 500 Index performance since April 2021. The top panel shows weekly momentum, which bottomed in oversold territory in April 2025 and now is moving upwards again, but is unlikely to reach overbought levels until Q3. The middle panel shows the price of the S&P 500 over the past 4 years, highlighting weakness in Q1 2025 followed by a rebound in Q2. The bottom panel shows the S&P 500’s advance-decline line, which remains positive and has made new all-time highs in May.
Source - RBC Wealth Management, Bloomberg, Optuma
Is it possible that the S&P is in a bear-market bounce and vulnerable to failing, as some market pundits have suggested? While we are always watching for technical evidence to suggest that our current market roadmap may be wrong, we view the strength of the S&P advance-decline line leading to the upside to new highs to be inconsistent with a bear-market rally. In addition, we view new cycle highs by other global indices, such as the MSCI EAFE (Europe, Australasia, Far East) Index, Germany’s DAX index, and Canada’s TSX, to be supportive of further U.S. equity market upside, and potentially, new cycle highs.
From a sector and investment-style (growth versus value) perspective, we continue to view growth stocks, such as technology, select media and consumer discretionary stocks, as likely to lead a rebound into Q3 before another pullback develops, which would be consistent with our broader equity market view outlined above. In contrast, more defensive sectors, such as utilities, staples, and healthcare probably continue underperforming, but we expect pullbacks in many stocks in these sectors to lead to more timely opportunities for investors to diversify portfolio exposure moving into Q3.
What other markets are noteworthy from a technical perspective? The U.S. dollar is likely at an important multi-month inflection point following a decline through 2025. Although the consensus opinion by global money managers turned negative for the U.S. dollar over the past five months, the weekly momentum indicator tracking 2–4+ month moves is oversold and bottoming for the U.S. dollar DXY index, with early signs of bottoming at support near a 98–100 support band. We encourage investors to monitor currencies closely moving into Q3, as we believe a bounce in the dollar is likely to coincide with further U.S. equity strength. Conversely, a break below the 98–100 band by the U.S. dollar DXY index could signal capital exiting U.S. assets and a growing risk of U.S. equity markets weakening.
Lastly, and arguably most importantly, the U.S. 30-year and 10-year yield charts are challenging important technical levels. Both interest rates have seesawed in sideways trading ranges since October 2023, but the U.S. 30-year yield is challenging the upper end of that range between 5.00%–5.18% over the past few weeks. A move above 5.18% would signal a two-year technical breakout with the next upside level near 6%. For the U.S. 10-year yield, the next upside level to monitor is 4.6%, and the upper end of its two-year range is between 4.8%–5.0%. A move by the U.S. 10-year yield above that band would technically suggest further upside toward 6% as well. While rising interest rates are a risk for equity markets, our expectation is for both the U.S. 30-year and U.S. 10-year yields to stall near current levels and remain range bound into Q3.
U.S. 30-year and 10-year yields – Weekly
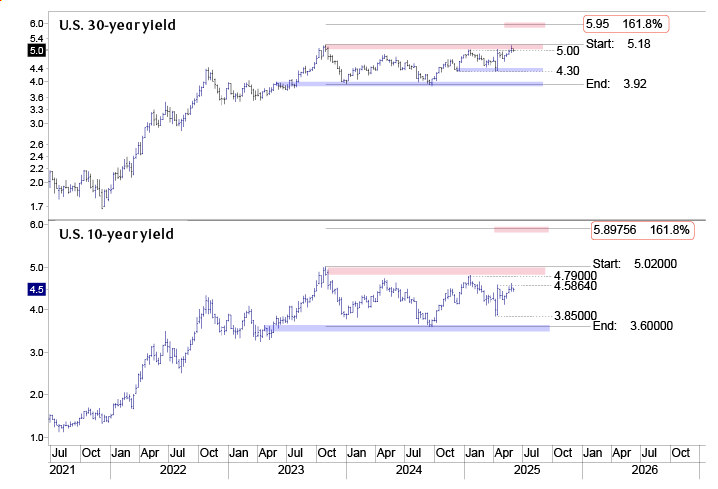
The line chart shows U.S. 30-year and 10-year Treasury yields, both of which are challenging important technical levels. The 30-year yield is near the upper end of its 2-year range near 5.18%. The 10-year yield is near 4.6%, with the upper end of its 2-year range being between 4.8% and 5.0%.
Source - RBC Wealth Management, Bloomberg, Optuma
If you are interested in more detailed technical commentary, please see our Weekly Chartbook, Weekly Roadmap or Monthly Long View publications.