Taking stock
Now in the fourth week of the war, the U.S. and Israel have made significant strides in degrading Iranian key infrastructure and larger naval assets. However, Iranian assaults on Middle Eastern energy infrastructure have been relentless, causing lasting damage. The Strait of Hormuz, a key choke point for global energy markets with about 20 percent of global oil and liquified natural gas (LNG) supply usually transiting it, remains severely restricted.
Hopes of de-escalation rose this week after multiple major U.S. news outlets reported that the Trump administration had relayed messages to Iran via third-party mediators, a claim that Iran’s Foreign Ministry confirmed. Even as diplomatic signals appeared to shift, however, U.S. forces continued to build up in the region, including the deployment of thousands of Marines and additional naval assets. Airborne forces reportedly are also on the way. All the while, Israeli strikes on Iranian infrastructure persist, and Iranian attacks on regional energy facilities and Israeli cities continue.
RBC Capital Markets, LLC’s Head of Global Commodity Strategy and Middle East and North Africa Research Helima Croft points out that this is not a conflict in which decisions are controlled by a single decision maker, unlike the Venezuelan episode. Iran has incentives to prolong the conflict, if only to restore deterrence against future American and Israeli military actions. For the Iranian regime, now run by younger, more hardline figures, the conflict appears existential. Moreover, it’s unclear the degree to which Israel calibrates its decisions with Washington, suggesting to us that escalation dynamics may not be fully synchronised between the two allies.
So even if U.S. President Donald Trump seeks a swift end to the conflict or aims for a ceasefire during negotiations—perhaps mindful of high U.S. gasoline prices and potential inflation pressures ahead of the November midterm elections—he may not be able to make a deal, as the decision does not lie solely in Washington. Iran and Israel also have a say.
Commodity market risks
The damage to Middle Eastern energy infrastructure is already extensive. The International Energy Agency (IEA) estimates that, so far, 40 Middle East energy facilities have been severely damaged across nine countries. It will take time, perhaps at least several months, for the oil fields, refineries, and pipelines to come back online. Qatar’s energy minister suggested it would take between three and five years to repair the damage to the country’s Ras Laffan natural gas facility from Iran’s recent missile attacks. It is responsible for 17 percent of Qatar’s LNG production capacity.
Overall, the IEA estimates that 11 million barrels per day (bbl/d) of oil have been lost. To put this in context, the oil shocks of the 1970s were for the loss of 4–5 million bbl/d. In addition, 140 billion cubic meters of natural gas have been lost compared to some 75 billion cubic meters associated with Russia’s invasion of Ukraine.
In Croft’s view, if the conflict were to persist for several months, with little improvement in maritime transit through the Strait, oil prices could exceed the 2008 high of $146/bbl. However, we think such a shock could be mitigated if energy shipments resume through the chokepoint, whether via bilateral agreements between Iran and friendly or neutral trading partners, or through alternative mechanisms. However, even with increased tanker flows, the region’s energy infrastructure would remain vulnerable absent a durable ceasefire, leaving oil prices elevated and susceptible to renewed spikes.
Natural gas prices could also continue to rise. A proxy used for global LNG prices is the price of gas at Europe’s main gas trading hub, the Dutch Title Transfer Facility. Prices have already roughly doubled from pre-crisis levels of around €32 per megawatt-hour (MWh) and could approach €130/MWh if outages persist and LNG flows remain disrupted. This is below the 2022 post Russia-Ukraine war peak of over €300/MWh, thanks to more supply having come on stream since then, though such levels would nonetheless be economically painful.
But it’s not only energy prices that are being affected. Given that the Strait of Hormuz also handles some 25 percent of global fertiliser exports and around 30 percent of urea trade, a prolonged disruption in the Strait would cause delays in fertiliser shipments. This and higher prices would likely weigh on crop yields later in the year, adding pressure to food prices. Helium supplies, a gas vital to semiconductor manufacturing, are also being negatively impacted.
U.S. and Canada versus others
RBC Economics urges investors to look at this energy crisis in the context of a U.S. economy whose backdrop remains relatively constructive. In RBC Economics’ view, it is hard to see a recession occurring because of this shock. The U.S. benefits from relative energy and food security. The federal government is running a fiscal deficit of six to seven percent of GDP—too high for many Americans’ comfort, but it’s stimulus nonetheless. Around 20 percent of household incomes consist of inflation-indexed social security transfers, near historic highs, while the unemployment rate remains close to record lows. At the same time, significant AI investments and productivity gains continue to support economic growth.
However, oil prices settling at $100/bbl could lift the Consumer Price Index towards 3.5 percent, complicating the Federal Reserve’s policy stance and placing additional strain on low- and middle-income households already absorbing a multi-year inflation wave, tariff pressures, and the prospect of higher borrowing costs.
Outside the U.S., countries that rely on imported energy, such as Japan, European states, some emerging economies, and to a lesser extent China and the UK, will likely feel the squeeze from higher energy prices. Countries that have closed refining capacity to offshore carbon-intensive industries are particularly at risk, in our view. A prolonged conflict would increase the economic downside in the most affected economies. Canada, as a net energy exporter, stands out to us as a potential beneficiary.
Some regions can weather the economic impacts of an energy shock better than others
Total percentage point change vs. RBC Global Asset Management’s forecasts
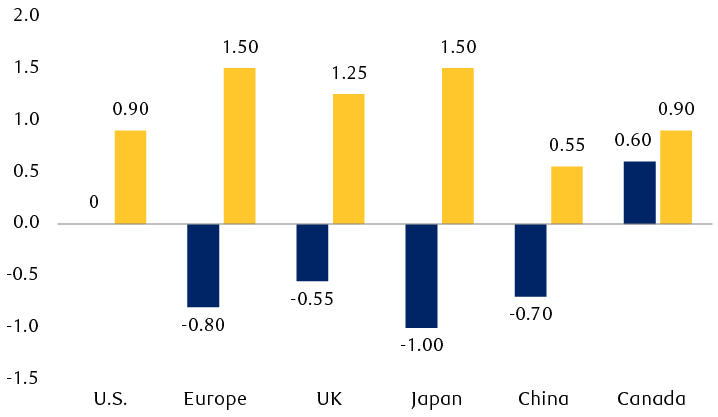
Note: Assumes a permanent $40/barrel increase in oil prices and a 50% increase in natural gas prices; as at March 9, 2026.
Source - RBC Global Asset Management, Bloomberg Economics, Organisation for Economic Co-operation and Development
Under a scenario that assumes a permanent $40/barrel increase in oil prices and a 50% increase in natural gas prices from pre-Middle East crisis levels, the bar chart shows the total percentage point change vs. RBC Global Asset Management’s forecasts for GDP and headline inflation for various regions. The U.S. would see zero impact to GDP and a 0.90 percentage point increase to inflation. Europe would see GDP decline by 0.80 percentage points and inflation increase by 1.50 percentage points. The UK would see GDP decline by 0.55 percentage points and inflation increase by 1.25 percentage points. Japan would see GDP decline by 1.00 percentage point and inflation increase by 1.50 percentage points. China would see GDP decline by 0.70 percentage points and inflation increase by 0.55 percentage points. Canada would see GDP rise by 0.60 percentage points and inflation increase by 0.90 percentage points.
Fixed income and equities
So far, the highest volatility has been observed in fixed income markets which have focused on the inflationary impact of the conflict. Expectations of further rate cuts for most central banks have flipped to the potential for multiple rate hikes. At some point, we think the focus will likely shift to the impact on economic growth, and this could end up tempering consensus rate hike expectations.
With respect to equities, risks are growing that this may turn into what RBC Capital Markets, LLC’s Head of U.S. Equity Strategy Lori Calvasina calls a “growth scare”—an episode in which fears of a recession that does not materialise start to be priced in.
In the five growth scares since the global financial crisis of 2008–09, the S&P 500 has experienced drawdowns of between 14 percent and 20 percent which have ranged in duration from two to nine months. Calvasina believes that equities have likely already entered a growth-scare drawdown. As it may take time for equity markets to fully assess the impact of the crisis on corporate earnings, it may not be a swift correction akin to the 2025 tariff episode, in her view, when the S&P 500 declined 19 percent and then quickly reversed course, climbing to a new all-time high less than three months later.
Lessons from the past
Crises often reshape government policy. The 1973–74 oil shock prompted many countries to establish strategic petroleum reserves to guard against future supply disruptions. Today’s crisis may similarly elevate energy security higher on policy agendas, accelerating investment in renewables, electrification, and potentially a broader revival of nuclear power.
For now, we think investors should expect heightened equity and fixed income market volatility, as the conflict could evolve along several different paths. Longer-term investors may wish to remember that in the major military conflicts since World War II, equity markets troughed well before the formal end of hostilities.