Key points
- Value without growth doesn’t work.
- Traditional value companies that are best able to capture and retain talent and are pragmatic in their adoption of technology solutions going forward are, in our view, likely positioned to see improvements in their earnings in the years ahead. This growth resurgence will likely help reignite the “animal spirits” driving earnings multiples higher, and thus returns, for the group.
- We believe investors who are willing to expand their traditional investment toolset to incorporate so-called extra-financial factors that feed growth stand to reap superior returns over time.
What is value?
The seeds of traditional value investing were sown by Benjamin Graham in his seminal works “Security Analysis” and “The Intelligent Investor: The Definitive Book on Value Investing,” published in 1934 and 1949, respectively. Graham’s work stands as the keystone of modern investment analysis, shifting the conversation around investing from speculation—which was the default practice prior to the 1929 stock market crash—to one of intrinsic value, or the calculated real value of a business based on earnings, assets, liabilities, and cash flows, among others.
Graham’s intrinsic value framework argued that stocks trading in short-term irrational markets may have a price that is higher or lower than what the business is really worth. This dislocation between what a company’s price is in the marketplace and what it ought to be based on company fundamentals over the long term means that a prudent investor should buy when market prices are lower than intrinsic value and sell when they are higher.
Building on the work of Graham, in 1992, Eugene Fama and Kenneth French developed a three-factor model that introduced size and value as investment factors in addition to market expectations that Graham and others had pioneered a generation earlier. Their work around these additional investment factors underscored Graham’s fundamental axiom that the market can be irrational in the short term but is efficient over time. Again, this means that investors should:
- Buy and hold undervalued stocks while letting market prices rise to meet intrinsic prices over time, and
- Sell or avoid overvalued stocks while letting market prices fall to meet intrinsic prices over time.
The resultant strategy—selecting value over growth—has been tremendously successful over the last 100 years, despite persistent weakness since 2007.
Cumulative value-factor returns, 1927–2022
Fama-French three-factor model high-minus-low book-to-price factor
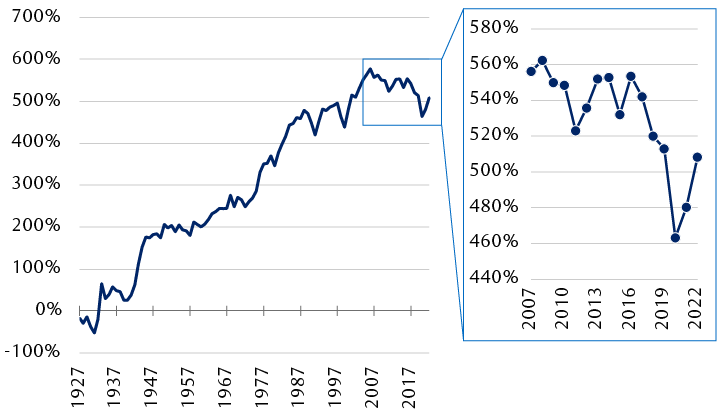
The line chart shows cumulative returns for an investment strategy based on buying “high book-to-market ratio minus low” (HML) companies from 1927 through 2022. The chart shows that value as a factor has steadily outperformed growth as a factor from 1927 until 2007 where the upward right line peaks at roughly 600 percent cumulative returns and starts to trend back downwards. A secondary chart highlights this downward revision between 2007 through 2022 with a vertical axis from 440% to 580%. The secondary chart starts in 2007 at nearly 560% and ends in 2022 at roughly 510%.
Source - Ken French, RBC Wealth Management
Does value work without growth?
Simply put, no. Warren Buffett, a student of Benjamin Graham’s when the latter taught at Columbia Business School, describes it most neatly: “There is no such thing as growth stocks or value stocks as Wall Street generally portrays them, as contrasting asset classes. Growth is part of the value equation.”
If true, how can we best see that this is the case and what happens if growth is slow or absent?
We can utilize index returns and their decomposition to better understand what underlying components drove value and growth returns over time and why value as a factor hasn’t worked relative to growth for nearly two decades. To illustrate, we will look at key drivers of return including:
- Earnings per share (EPS) and price-to-earnings (P/E) multiples as drivers of price appreciation, and
- Dividend yields and reinvestment to provide a view into total shareholder return.
For comparison, we will use the Russell 1000 Value Index (the Value Index) and the Russell 1000 Growth Index (the Growth Index).
We focus on two key periods. The first is from 1995 through 2006 during which value continued to work as it always had; we denote this as the “traditional value” regime. The second is from 2007 through 2023 where value as a factor no longer seemed to work in the same way; we’ll call this the “intangible value” regime.
Let’s look at the total shareholder returns data for each index and for each regime.
The first observation is revelatory in that intangible value clearly has a growth problem … specifically, a lack thereof.
Value and growth return components: Total shareholder return decomposition
Value
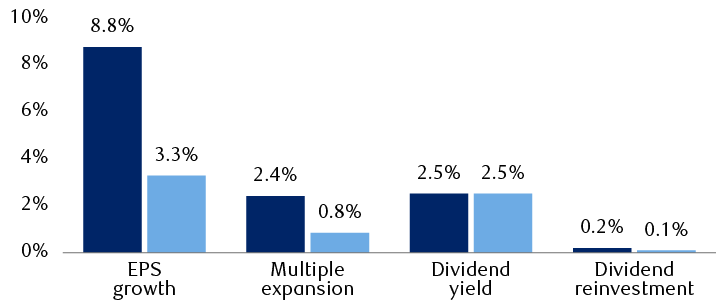
The exhibit consists of two separate column charts that break down total shareholder returns for Value and Growth investment styles. These returns are divided into four categories: EPS growth, multiple expansion, dividend yield, and dividend reinvestment. For each of these categories, returns are further broken down into two time periods: “traditional” from 1995 to 2006, and “intangible” from 2007 to 2023. In the Value style chart, EPS growth is 8.8% for the traditional period vs. 3.3% for the intangible period, multiple expansion is 2.4% vs. 0.8%, dividend yield is 2.5% vs. 2.5%, and dividend reinvestment is 0.2% vs. 0.1%. In the Growth style chart, EPS growth is 5.5% for the traditional period vs. 6.4% for the intangible period, multiple expansion is 2.6% vs. 4.1%, dividend yield is 1.0% vs. 1.3%, and dividend reinvestment is 0.1% vs. 0.2%.
Source - RBC Wealth Management, Bloomberg
Growth
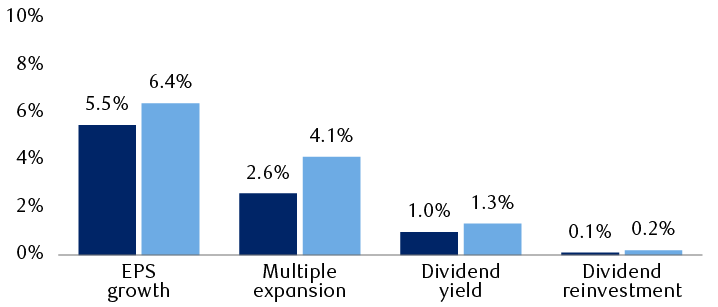
Source - RBC Wealth Management, Bloomberg
On the value chart we can see that EPS growth for the Value Index was very strong in the 1995–2006 period, rising by 8.8 percent per annum. That persistent strength persuaded investors to pay more for each dollar of current earnings (i.e., boost the P/E multiple or sometimes known as “animal spirits”), adding a further 2.4 percent per annum to already robust returns. But in the following 2007–2023 period, earnings growth slowed markedly to just 3.3 percent per annum. Investors lost their enthusiasm for the Value Index with returns from valuation expansion collapsing by two-thirds to just 0.8 percent.
But the growth chart shows a very different outcome for the Growth Index. Moderate EPS growth in the 1995–2006 stretch accelerated somewhat to a healthy 6.4 percent per annum from 2007 to 2023 at the same time as value returns sagged by almost two-thirds. Investors’ “animal spirits” were aroused as they headed toward the superior EPS returns of the Growth Index, in the process boosting the added returns delivered by P/E expansion by a rich 4.1 percent per annum compounded over 16 years.
What happened?
Not just in the 1995–2006 period depicted in the charts but throughout the entirety of the 20th century traditional value had seemingly benefited from the advent and evolution of operations management (i.e., mass production, Six Sigma, just-in-time, “kaizen” or the Japanese concept of continuous improvement, etc.). Process enhancements and the introduction of rudimentary technology and automation for mass manufacturing of real goods in the real economy are strong contenders in providing explanation for most of the century-long earnings tailwinds that traditional value companies had benefited from.
That said, it seems fair to suggest that over the intangible growth regime from 2007 to 2023, earnings have expanded in large part from the rise and utilization of new, disruptive technologies which saw dramatic inflection and adoption in the early 2000s (i.e., internet, mobile broadband, Wi-Fi, laptops, social media, smartphones, instant payments, smart devices, software-as-a-service, etc.). Having this first-mover advantage with radically improved technology has helped to build business efficiencies across key financial and extra-financial factors (i.e., factors that are not captured in the financial statements) such as human and social capital management, along with business model improvements in ways that were never previously available.
The integration of technology generated meaningfully robust intangible assets and business efficiencies that have translated to continued earnings growth. This has led investors to drive up the intangible growth multiple from 2.6 percent to 4.1 percent of the per annum price appreciation figure for the index between the two periods, with the anticipation that there is more to come.
So, is value dead?
Not exactly, but the world is a different place today. As the digital economy and technologies continue to grow and mature, we do believe that some old dogs can learn new tricks.
Consider the backbone of technology—an extra-financial metric known as human and social capital, or simply put, people. Without talented, technologically adept people, or the incentive structures to attract and retain them (i.e., pay, career growth, job satisfaction, corporate culture, and other notorious tech company-related perks like free lattes, nap pods, or bringing your dog to work …), incremental growth and innovation at the leading edges will begin to slow. Likewise, as technology innovation has concentrated this skilled labor in very few pockets across the intangible growth universe, marginal gains from high-caliber talent across maturing platforms will eventually approach zero. This prompts an important question: how many software engineers or data scientists are needed to develop the next version of a leading smartphone? Probably the same or fewer than the last version as operational efficiencies in these now maturing business models take hold. This dynamic has, in part, led to an unprecedented wave of nearly 670,000 layoffs across more than 2,000 technology companies over the last two years, including a significant number from the “Magnificent 7” (Apple, Microsoft, Google, Amazon, NVIDIA, Meta Platforms, and Tesla).
Tech layoffs
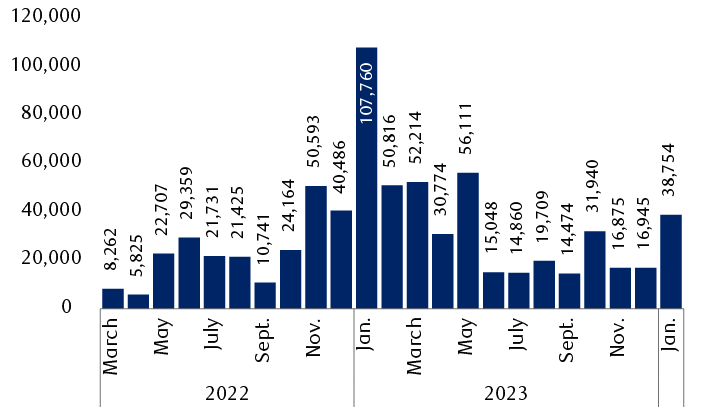
The column chart shows the number of tech workers laid off each month from March 2022 through January 2024. Layoffs were relatively low until November 2022, the beginning of a six-month period during which layoffs peaked at 107,760 in January 2023. Monthly layoffs have declined since then, but remain elevated relative to levels before November 2022.
Source - TrueUp
With intangible growth’s stranglehold on high-caliber technology talent abating, we believe this provides a boon for value companies where data science has had low or no penetration—which is the lion’s share of the index. Value companies that are best able to capture and retain talent and are pragmatic in their adoption of technology solutions going forward are, in our view, likely positioned to see improvements in their earnings in the years ahead. This growth resurgence will likely help reignite the “animal spirits” driving earnings multiples higher, and thus returns, for the group.
Where to fish for growth?
Our read of the investment narrative over the last several decades has been one where the market has seemingly self-segregated into two distinct investment groups—value or growth. We believe this shift, coupled with the dynamics noted above, has now set the table for patient and nuanced investment in these seemingly “left-for-dead, unimaginative, non-innovating, and stuffy old economy businesses” that, ironically, have the most to gain from leaning into and upgrading their intangible assets—such as human and social capital, brand equity, intellectual property, and network effects, among others.
We believe investors who are willing to expand their traditional investment toolset to incorporate non-traditional, extra-financial factors that feed growth stand to reap superior returns over time. So, as Mark Twain noted to the newspaper upon reading his own obituary, “the reports of my death have been greatly exaggerated,” we believe that value is not yet dead.