Steady economy
The world economy remains in expansion, though growth trajectories for major countries are uneven. As the bellwether for global growth, the U.S. economy continues to lead the pack in terms of momentum. Following the same script as 2023, U.S. real gross domestic product (GDP) growth estimates have seen the most significant upward revisions since the beginning of this year.
U.S. economy has better momentum
Real GDP forecast revisions (y/y)
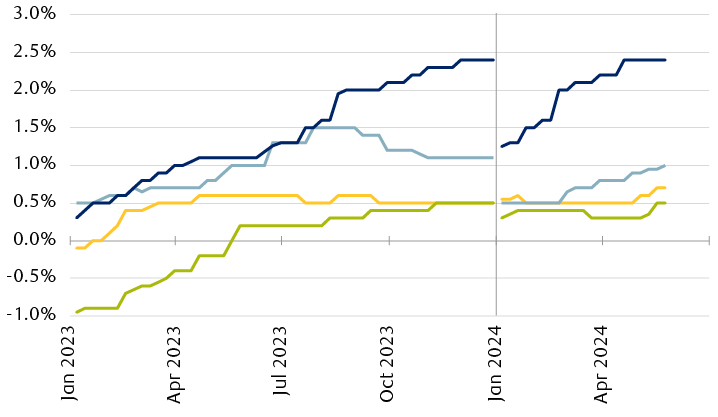
The line chart shows real GDP growth estimates for the Eurozone, UK, Canada, and U.S. from January 2023 through May 2024. All estimates have followed general upward trends over the period shown, with the most significant revisions since the beginning of 2024.
Source - RBC Wealth Management, Bloomberg; data through 5/24/24
We think the sustained strength of the U.S. economy can be mainly attributed to resilient household spending, which constitutes roughly 70% of GDP. Reinforcing robust consumer activity is a labour market that is churning out new jobs at a solid pace, accompanied by higher wages. As incomes grow, consumers tend to spend more. The “wealth effect” from substantial gains in home and financial asset prices has likely also bolstered household spending.
Bumpy disinflation
Inflation has retreated sharply in major developed economies. But much like the economic outlook, the progress of inflation returning to central bank targets has been varied and, in some instances, slower than expected.
Inflation within striking distance of central bank goals
Headline consumer price index (y/y)
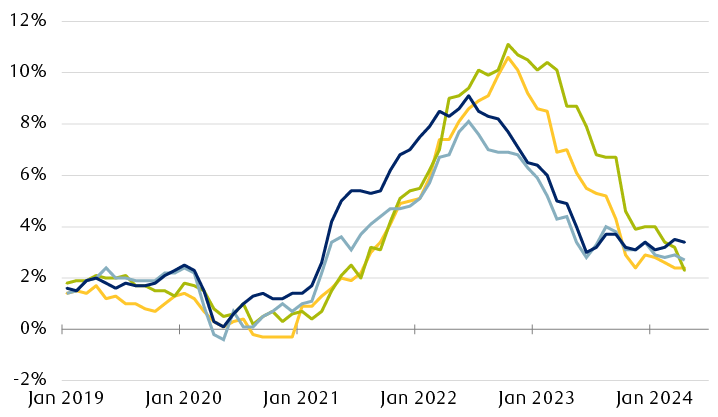
The line chart shows headline consumer inflation year over year for the Eurozone, UK, Canada, and the U.S from January 2019 through May 2024. All regions experienced rising inflation from the beginning of 2021 through late 2023, but inflation has since fallen and is now between 2% and 4%.
Source - RBC Wealth Management, Bloomberg; data through 5/24/24
This trend is most evident in the U.S. where inflation figures have surprised more frequently on the upside this year. While we think the “last mile” of excess inflation will still take some time to navigate, we remain reasonably confident that inflation in most economies, including the U.S., is on a downward trajectory over the coming quarters. This outlook is supported by expectations of an easing in the lagging components of the inflation basket—most notably housing categories—and labour market conditions moving into a better balance between supply and demand of workers that can help moderate upward wage pressures.
Another promising disinflationary signal comes from the corporate sector: The number of S&P 500 companies citing inflation on their earnings conference calls declined for the seventh consecutive quarter in Q1 2024 and is on track to be the lowest since Q2 2021, according to FactSet.
Patient central banks
With inflation taking longer to normalize, central bankers are counseling patience regarding a pivot towards less restrictive monetary policy. Policymakers have emphasized their desire to see more evidence of well-behaved inflation at or near target levels before implementing rate cuts.
Amongst the four major central banks, the European Central Bank and Bank of Canada will lead in initiating the easing cycle, according to RBC Capital Markets, with the first rate cut expected in June. The Bank of England is projected to follow in August, and the Federal Reserve in December.
These forecasts align closely with current probabilities reflected in interest rate futures and, in our view, appear reasonable. Growth momentum and price pressures in the eurozone and Canada have softened more visibly. Recent UK macro data has exhibited a sturdier tone, hinting the economy is faring better than policymakers had expected. Meanwhile, the resilience of the U.S. economy affords the Fed the luxury of time to await greater conviction on the path of inflation.
With mixed growth and inflation trends clouding the monetary policy outlook, the “higher-for-longer interest rates” narrative seems likely to persist in the near term, in our opinion.
Bond yields have rebounded …
10-year government bond yields
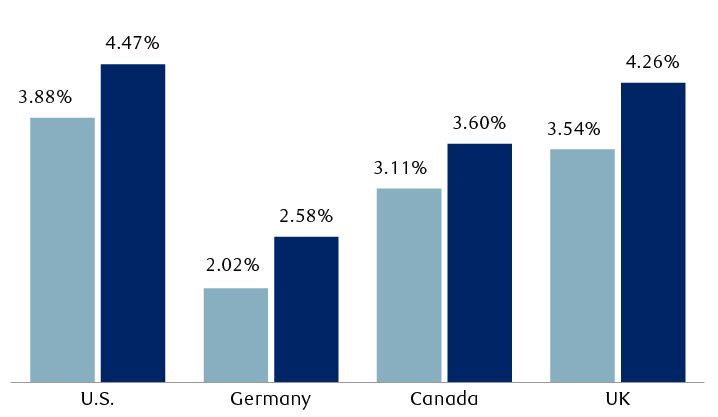
The column chart compares the yield on 10-year government bonds in the U.S., Germany, Canada, and the UK on January 1, 2024 and May 24, 2024. Yields are now higher than they were at the beginning of the year. U.S.: 3.88% in January vs. 4.47% currently. Germany: 2.02% vs. 2.58%. Canada: 3.11% vs. 3.60%. UK: 3.54% vs. 4.26%
Source - RBC Wealth Management, Bloomberg; data through 5/24/24
… as investors have tempered rate cut expectations
Interest rate expectations
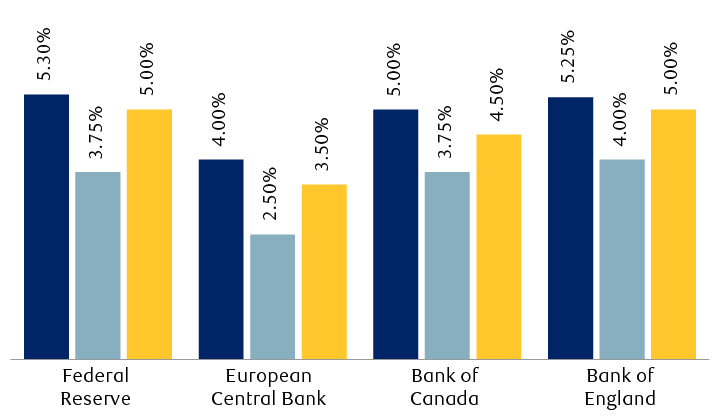
The column chart shows the current policy interest rate published by the Federal Reserve, the European Central Bank, the Bank of Canada, and the Bank of England, in comparison to the expected policy rate at the end of 2024 at two points in time: in mid-January 2024 and currently, at the end of May 2024. Current policy rates are: Federal Reserve, 5.30%; European Central Bank, 4.00%; Bank of Canada, 5.00%; Bank of England, 5.25%. Mid-January expectations were: Federal Reserve, 3.75%; European Central Bank, 2.50%; Bank of Canada, 3.75%; Bank of England, 4.00%. Current expectations are: Federal Reserve, 5.00%; European Central Bank, 3.50%; Bank of Canada, 4.50%; Bank of England, 5.00%.
Source - RBC Wealth Management, Bloomberg; data through 5/24/24
Putting it all together
Despite uncertainties surrounding inflation, borrowing costs, geopolitical tensions, and the economy, global equities have delivered worthwhile gains. Year to date, the MSCI All-Country World Index has risen roughly 8.5% on a total-return basis.
Two fundamental drivers have been at play. First, the economy has continued to progress steadily. A growing economy has, in turn, fed into the second driver, which is an improving outlook for corporate earnings. The combination of durable economic growth, expense control, and share buybacks, in our view, can enable profits to advance further, providing a foundation for stocks to move higher in the quarters ahead.
Nevertheless, elevated starting valuations suggest to us that consistently strong earnings delivery and sustained investor willingness to pay above-average multiples for those profit streams will be crucial for keeping equity markets on an uptrend. Bloomberg estimates show earnings for the MSCI All-Country World Index to increase by approximately 8% this year.
Global equity valuations reflect an optimistic outlook
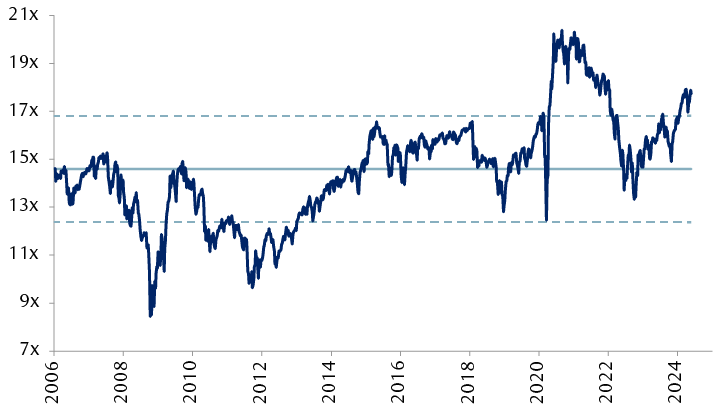
The line chart shows the forward price-to-earnings ratio of the MSCI All-Country World Index from 2006 through May 2024. The ratio has generally risen since late 2022 and is currently more than 1 standard deviation above its long-term average.
Source - RBC Wealth Management, Bloomberg; data through 5/24/24
Meanwhile, renewed inflation volatility has led markets to push back the timing and amount of potential central bank rate cuts this year. While the uptick in bond yields this year has dampened returns in fixed income markets, we continue to see a range of opportunities with adequate risk-reward profiles for investors with a multi-year horizon to deploy capital. Given the current environment of limited compensation for taking credit risk, we advocate a selective, quality-oriented approach to fixed income exposure.
Valuations across major asset classes
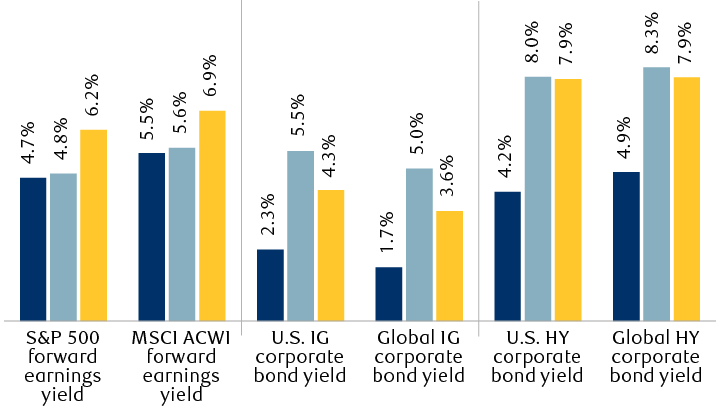
The column chart shows the S&P 500 forward earnings yield, MSCI All-Country World Index forward earnings yield, U.S. investment-grade corporate bond yield, global investment-grade corporate bond yield, U.S. high-yield corporate bond yield, and global high-yield corporate bond yield on January 1, 2022 and currently, and the averages since 2002.
Earnings yield is the inverse of the forward price-to-earnings ratio. Bond yield refers to yield to worst for the Bloomberg U.S. Corporate Index, the Bloomberg Global Agg Credit Index, the Bloomberg U.S. Corporate High Yield Index, and the Bloomberg Global Corporate High Yield Index.
Source - RBC Wealth Management, Bloomberg; data through 5/24/24