When external events hit the stock market and stoke uncertainty or fear, such as the current Middle East crisis, volatility usually works in both directions—downward and upward.
The S&P 500 declined 7.8 percent from when the U.S. and Israeli strikes on Iran began on February 28 through March 30. Stocks representing the rest of the world, measured by the MSCI ACWI ex USA Index, dropped 11.2 percent during the same period.
Then amid some verbal signs that the U.S. is eyeing an offramp, stock markets reversed course with each of these indexes jumping about 3.7 percent in total on Tuesday and Wednesday of this week.
We think there could be more twists and turns in the Middle East crisis in the near term, along with additional stock, bond, and energy market volatility.
Our advice to long-term investors is to take some deep breaths and count to 100, so to speak, before making big asset allocation and sector changes.
Par for the course
Rule of thumb when it comes to stock investing: Pullbacks and corrections are more common than one might think.
- In the modern era since 1980, the S&P 500 has experienced 25 peak-to-trough declines of 10 percent or more at some point during the year, as the chart shows, in the yellow data. The average decline was 14 percent.
- Nevertheless, since 1980, the S&P 500 traded higher for the full year in 35 of the 46 years, reflected in the chart’s blue bars. In 28 of those instances, gains were 10 percent or more.
- There was only one stretch when the market delivered negative returns in consecutive calendar years: 2000, 2001, and 2002.
- During this lengthy period from 1980 to 2025, the S&P 500 surged from the 108 level to 6,845. This occurred despite the fact that the time frame included six recessions, four separate bouts of consumer inflation above five percent, Washington and Federal Reserve policy errors, wars, and some other rather challenging external events that were thrust upon the market.
Pullbacks and corrections are normal
S&P 500 performance and maximum drawdowns by year (average annual maximum drawdown: 14%)
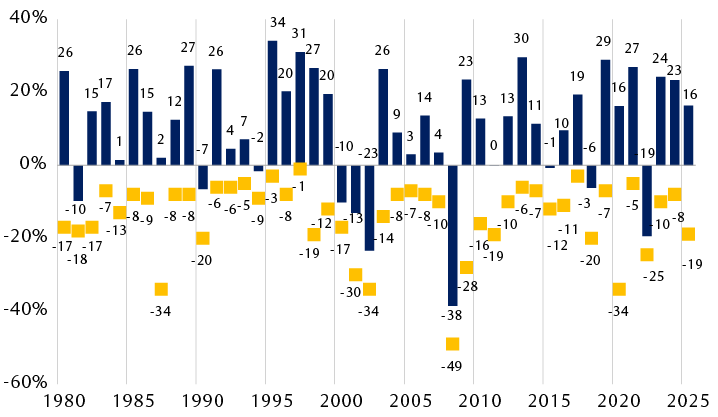
Source - RBC Global Asset Management, RBC Wealth Management, Bloomberg; price return data (not including dividends)
The chart shows the calendar year price returns and maximum annual peak-to-trough price declines (drawdowns) for the S&P 500 from 1980 through 2025, in percentage terms. Drawdowns occurred in all years shown, regardless of whether annual performance was positive or negative. The average maximum annual drawdown was 14%. In 2025, the market produced a 16% total return despite a maximum drawdown of 19%.
Each pullback or correction usually has its own unique catalysts—whether it’s moderate, substantial, or something in between, and whether it is sharp or something that unfolds at a slower pace.
One has to only recall the four most notable corrections of this century when the catalysts were rather dissimilar, and durations differed:
- The ultrahigh tariff scare in April 2025,
- The global COVID-19 pandemic selloff in 2020,
- The global financial crisis and U.S. housing crisis in 2008–2009, and
- The bursting of the U.S. technology bubble in 2000–2002.
But there were some patterns associated with military interventions and other geopolitical risks that are relevant to consider today.
In 20 such events since World War II, the S&P 500 fell six percent, on average, from the initial market impact to the trough level. In 19 of the 20 events, the market took an average of only 28 days to return to where it had been prior to the military interventions and geopolitical events.
There were some anomalies, however. When military actions resulted in Middle East oil supply constraints in 1973 and 1990, the S&P 500 declined more, about 16 percent during each episode, and the corrections lasted longer than those associated with other military events.
Back to basics
For investors who have been jarred by the recent volatility and/or the specific circumstances and risks associated with the Middle East crisis, we think now is a good time to weigh the following:
- Is your long-term strategic broad asset allocation where it should be given your investment time horizon, stage of life, risk tolerance, financial goals, and other factors? Meaning, is your targeted allocation for stocks, bonds, and cash (and other relevant asset classes) appropriate? We often find that some of the stress associated with extreme market moves is because this long-term strategic allocation is misaligned with either risk tolerance, stage of life, or some other personal factor.
- Is your current allocation roughly in line with your long-term strategic allocation? If not, is there a good reason that it’s offside?
- Is the mix of U.S. versus non-U.S. equity exposure in your portfolio where it should be given your long-term financial goals? U.S. stocks have outperformed somewhat during this correction, and we think that could continue if the Middle East crisis persists. This is largely because a number of European and Asian (excluding China) economies are far more dependent on crude oil and natural gas imports and therefore seem more vulnerable to energy supply shocks. However, if the crisis gets resolved soon or Strait of Hormuz tanker shipments increase meaningfully, European and Asian equity markets could come back into favor as they were last year, especially given their discounted valuations relative to the U.S.
- Are the types of equity holdings in your portfolio aligned with your broader financial goals? Meaning, is the proportion of dividend-paying stocks, growth and value stocks, and sector and industry exposures in line with your objectives?
If you’re unsure about some of these questions, we highly recommend contacting your RBC advisor.
A portfolio’s long-term strategic asset allocation between stocks, bonds, and cash, and the specific sub-asset class allocations that flow underneath are put in place for times like this. They are intended to be an anchor during periods of extreme volatility.
We think financial markets will continue to be volatile in the weeks and months ahead. It’s important to have your long-term investment strategy nailed down, and allocations that correspond to it.
For additional thoughts about equity and fixed income positioning amid the Middle East crisis, including views of regional markets as well as commodities and currencies, see the recently published April Global Insight report.