The major U.S. equity indexes are at an important technical inflection point, in our view, following a 100 percent rebound by the S&P 500 and a 150 percent rally by the Nasdaq 100 from their cycle lows in Q4 2022. With the current cycle moving into its fourth year, and the average 3–4 year upcycle generating upside average returns of 110 percent during the structural bull markets of the 1950s–1960s, 1980s–1990s, and the 2010s–2020s, we encourage investors to pay attention to the market’s technical profile for signs a top may be developing.
The Q4 2025–Q1 2026 equity rotation
Both the S&P 500 and Nasdaq 100 have traded sideways in a narrow range since Q4 2025 as investors reallocated capital away from Technology toward other equity markets and most other sectors given its elevated valuations and historically high market concentration.
Nasdaq 100 challenges a key technical level
The tech-heavy Nasdaq 100 is particularly noteworthy given that we believe it is at a key technical “make or break” point following 4+ months of trading in a narrow range to a widely watched level coinciding with its 200-day moving average. Interestingly, the weekly momentum indicators we follow to identify potential turning points over a 1–2 quarter time frame transitioned from overbought (high) levels in late Q3 2025 to oversold (low) levels moving into the end of February just as the index tests a key support level near 24,000.
Nasdaq 100 index tests important technical support near its rising 200-day moving average
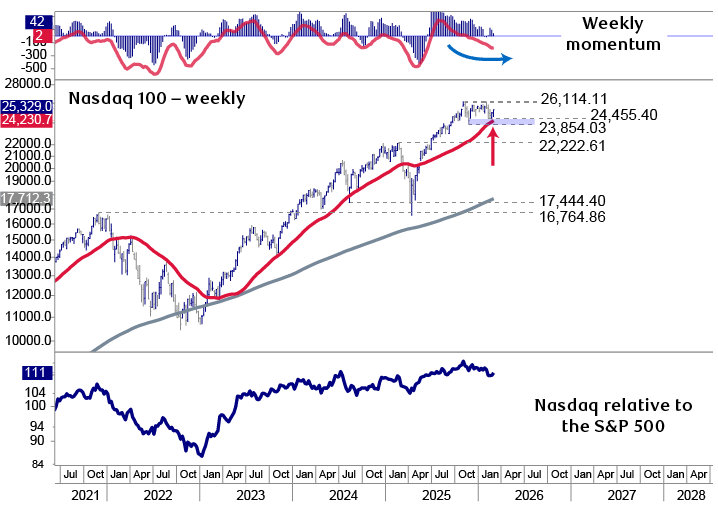
Source - RBC Wealth Management, Bloomberg, Optuma; data through 2/25/26
The chart shows technical momentum indicators for the Nasdaq 100 Index and its absolute and relative price performance since July 2021. The top panel shows weekly momentum, which peaked in Q3 2025 and is now becoming oversold as the Nasdaq 100 Index in the center pane has traded sideways in a narrow range above a key technical level at 24,000 near its rising 200-day moving average. The bottom panel illustrates the Nasdaq 100’s performance relative to the S&P 500, which has pulled back since Q4 2025 to test an uptrend that began in Q4 2022.
Could growth stocks rally?
While we think it is premature to conclude a rotation back to growth and Technology stocks is underway, the technical backdrop suggests a rebound is likely as the megacap semiconductor stocks show early signs of stabilizing near important support at rising 200-day moving averages. Meanwhile, the “waterfall declines” in software stocks over the past few months have left them at oversold levels near support bands where we expect many to begin establishing a bottoming pattern.
Innocent until proven guilty
The bottom line is that although the 2022–2026 market cycle has rallied a long way since its Q4 2022 lows, and while elevated valuations remain an ongoing fundamental concern, technically it is premature to turn overly cautious on equities, in our view. In any given year, equity leadership ebbs and flows between sectors over a roughly 1–2 quarter time frame. Given most of the non-Technology sectors have surged to technical levels we view to be well advanced over the past 4+ months, a rotation to growth stocks that have pulled back to support levels appears likely.
What would turn the technical backdrop negative?
A break below 6,721 and the 200-day moving average for the S&P 500 and below 24,000 and the rising 200-day moving average for the Nasdaq 100 would indicate, in our view, that the Q4–Q1 trading ranges are resolving to the downside and likely suggest a peak for the 2022–2026 cycle uptrend.
A technical indicator to monitor the rotation within equities
In our last Global Insight Weekly technical update in October 2025, we featured the two-panel chart below to highlight the diverging trends within the S&P 500. The top panel illustrates the growth stock-heavy S&P 500 consolidating sideways in a narrow range since Q4. In contrast, the indicator in the bottom panel tracks the average 1–2 quarter change in price of all S&P 500 stocks regardless of their size. We have found this indicator to be a useful gauge to monitor how stocks are behaving, and it was helpful at that time to suggest the potential for a rotation toward many of the non-Technology sectors that pulled back through Q3 into Q4.
S&P 500 tests support while our momentum indictor suggests more sector rotation in Q2
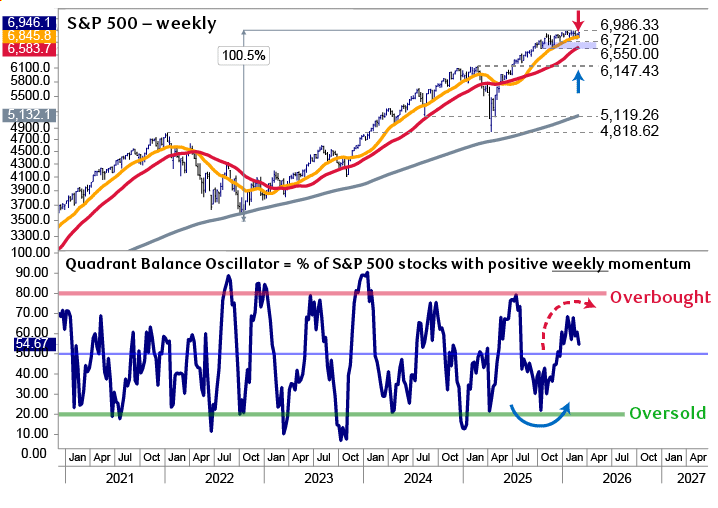
Source - RBC Wealth Management, Bloomberg, Optuma; data through 2/25/26
The chart shows the price performance of the S&P 500 since January 2021, illustrating the rebound from the Q4 2022 lows to the highs in Q4 2025. The S&P 500 has traded in a narrow range since Q4, above key support levels starting at 6,721, which we view as a key downside risk control level. The bottom panel illustrates a custom momentum indicator that tracks the weekly change in momentum for all S&P 500 stocks. The indicator bottomed in Q4 2025 when a rotation to many non-technology sectors was developing. That indicator has now transitioned back to overbought (high) levels and appears to be starting to stall.
Ebb and flow as the rotation to non-Technology stocks looks likely to pause again
While this indicator was oversold (low) in Q4, it has built steadily to the upside through Q1 reflecting the broad rebound in most sectors outside of Technology, notably Financials, Utilities, Consumer Staples, Health Care, Industrials, Materials, and, more recently, Energy. Now, however, with most stocks in those sectors having rallied strongly, the indicator is transitioning back to overbought (high) levels with the risk a pause/pullback could develop moving through late Q1 into Q2.
Cautiously optimistic but we continue to monitor downside risk control levels
The bottom line is that we think it will be important for the megacap growth stocks that have either paused or pulled back since Q4 to begin stabilizing and rallying to keep the overall market cycle intact. While our expectation is that a rotation back to growth appears likely, an inability to do so would lead to the S&P 500 and Nasdaq 100 breaking below the key support levels highlighted above that we view to be useful downside risk control levels. A well-diversified portfolio remains prudent moving through 2026, which we continue to expect will be volatile consistent with the pattern of many U.S. midterm election years.