Key points:
- The transformative potential of artificial intelligence technology extends across virtually all industries, but identifying long-term winners is challenging.
- The emergence of the personal computer and the internet provide lessons on how AI adoption could filter through the economy and markets.
- As markets respond to the AI rollout, disciplined diversification can help investors guard against unintended risks.
A year of solidly uneven performance
Viewed from a high level, 2023 has been a rewarding year for the stock market. Year to date, the MSCI All-Country World Index (ACWI) and the S&P 500 Index have advanced roughly nine percent and 13 percent on a total return basis, outpacing their respective average annual gains of 8.4 percent and 9.3 percent over the past 25 years. Trends beneath the surface, however, reveal that most of those above-average gains have been fueled by only three sectors.
AI-linked sectors set the pace
Year-to-date total returns by equity sector
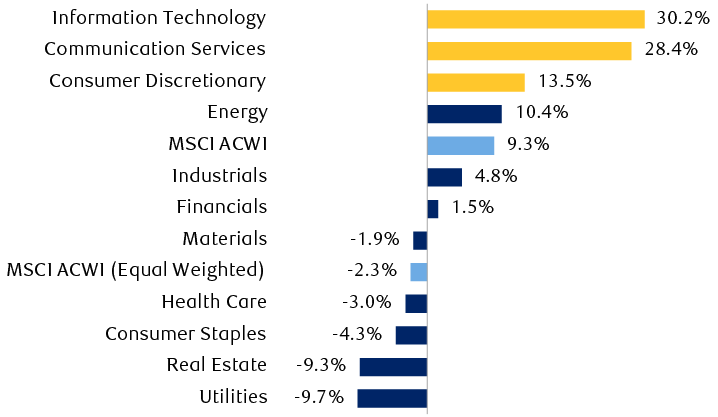
Bar chart showing year-to-date performance through October 19, 2023 for the MSCI All-Country World Index, MSCI All-Country World Equal-Weight Index, and eleven major equity sectors. Information Technology, 30.2%; Communication Services, 28.4%; Consumer Discretionary, 13.5%; Energy, 10.4%; MSCI ACWI, 9.3%; Industrials, 4.8%; Financials, 1.5%; Materials, -1.9%; MSCI ACWI (Equal Weighted), -2.3%; Health Care, -3%; Consumer Staples, -4.3%; Real Estate, -9.3%; Utilities, -9.7%.
Source - RBC Wealth Management, Bloomberg; data through 10/19/23; return calculations based on MSCI ACWI sector index series.
A common factor propelling those three sectors has been burgeoning interest in artificial intelligence (AI) technologies, as recent significant breakthroughs kicked off a wave of optimism around the prospect of a new and durable growth pathway for a number of companies in the Information Technology, Communication Services, and Consumer Discretionary sectors.
Weights matter
2023’s leading sectors as proportions of global equity indexes
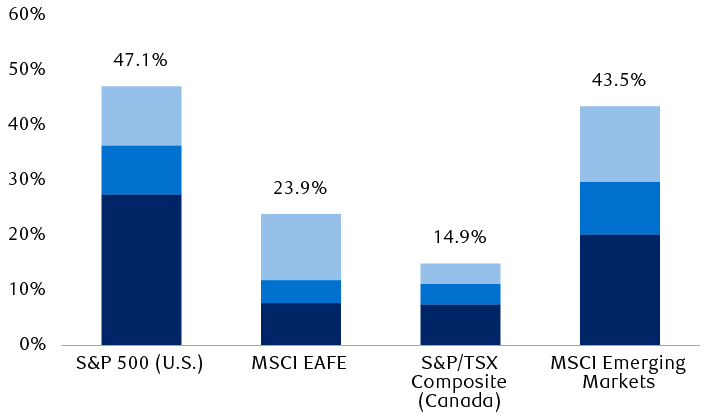
Column chart showing the weights of the Information Technology, Communication Services, and Consumer Discretionary sectors, and the combined weight of the three sectors, as percentages of the total indexes as of September 30, 2023, for the S&P 500, MSCI EAFE Index, S&P/TSX Composite and MSCI EM Index. S&P 500 (U.S.): 27.5%, 8.9%, 10.7%, 47.1%. MSCI EAFE: 7.73%, 4.14%, 12.04%, 23.9%. S&P/TSX Composite (Canada): 7.5%, 3.7%, 3.7%, 14.9%. MSCI Emerging Markets: 20.22%, 9.56%, 13.7%, 43.5%.
Source - RBC Wealth Management, Bloomberg, MSCI, S&P Dow Jones; data through 9/30/23
The U.S. stock market has been the performance leader for most of the year, as it offers considerably more exposure to companies perceived to be major beneficiaries of the accelerating AI buildout. These range from firms that supply foundational hardware and infrastructure (such as semiconductor chips and data centres) to those that design software and provide related services (including end-user applications and cloud computing), amongst others.
Regional performance is also uneven
Year-to-date total returns
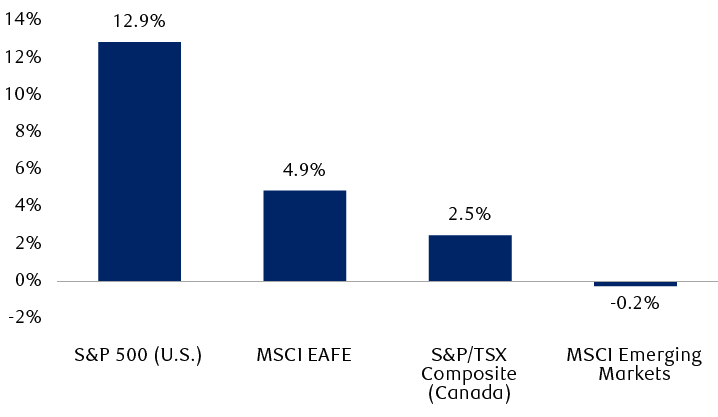
Column chart showing the year-to-date performance through October 19, 2023 for the S&P 500, MSCI EAFE Index, S&P/TSX Composite and MSCI EM indexes. S&P 500 (U.S.), 12.9%; MSCI EAFE, 4.9%; S&P/TSX Composite (Canada), 2.5%; MSCI Emerging Markets, -0.2%.
Source - RBC Wealth Management, Bloomberg; data through 10/19/23
The promise of generative AI
Artificial intelligence technologies are thought to hold immense promise because they are seen as possessing the capacity to impact virtually every industry. A defining attribute of a general-purpose technology lies in its capacity for wide application across all sectors of the economy.
For instance, consider ChatGPT, an acronym for “Chat Generative Pre-trained Transformer,” a generative AI application that can produce startlingly humanlike conversational dialogue. Trained using vast amounts of textual data from the internet, ChatGPT’s AI employs natural language processing algorithms that enable it to analyze, manipulate, and generate text in response to input from human users.
The potential for ChatGPT and other generative AI chatbots to turbocharge productivity has motivated companies across many industries to explore different ways of deploying and integrating these technologies in their businesses.
Yet text is merely one branch of the generative AI story. Rapid progress in similar “deep-learning models” stretches into the realms of images, audio, video, and software coding, to highlight just a few modes. These advances could eventually pave the way for so-called “multimodal” generative AI, enabling more powerful functions with wider-ranging applications than current models that are restricted to a single data mode.
Lessons from the emergence of other recent general-purpose technologies—such as the personal computer (PC) and the internet—offer three potential insights on how AI adoption could filter through the economy and markets: (1) it takes time for these technologies to achieve widespread acceptance; (2) the adoption will likely involve several waves of innovation; and (3) assessing the long-term winners and losers is difficult.
The personal computer and the internet were introduced in the late 1970s and early 1980s. But because it took several decades to build a critical mass of users, the U.S. economy did not see productivity improvements driven by these innovations until the latter half of the 1990s, in a trend that lasted through the mid-2000s.
U.S. productivity growth has come in waves
Five-year rolling average, y/y
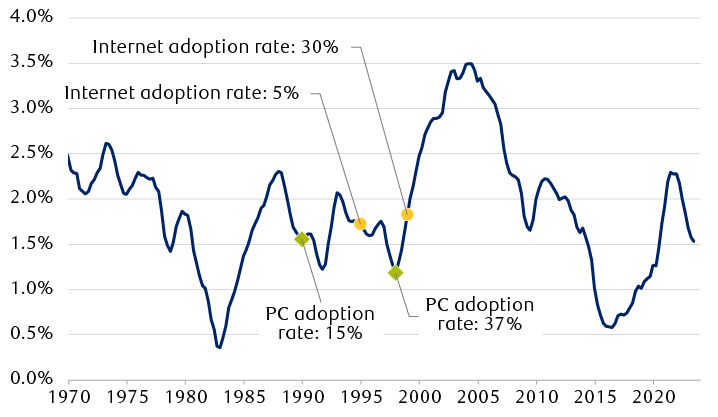
Line chart showing the rolling five-year average U.S. productivity growth from 1970 through June 2023. The line shows a series of increases and decreases.
Source - RBC Wealth Management, Bloomberg, U.S. Census Bureau, World Bank; data through 6/30/23
During this period, there was a pronounced boom-bust sequence in equity markets as investors first embraced an increasingly buoyant view on productivity gains and their presumed positive implications for profits, then tempered their expectations as the anticipated benefits took longer to materialize than initially expected. Despite a notable and durable improvement in productivity from 1997 to 2005, initial optimistic projections of profitability ultimately proved to be unrealistically high and premature. This can be partly attributed to the fact that so-called “killer apps”—products innovative enough to influence business and consumer trends, laying the foundations for durable business models—often take time to develop from an emerging technology.
During the PC/internet era, the search engine emerged as a pivotal killer app, but Google did not really hit its stride until the early 2000s, about five to 10 years into the rapid-adoption phase for the PC and internet. Similarly in the mobile device era, social networks and instant messaging platforms, two of the leading applications (amongst many) created to monetize mobile device use, took more than five years to gain traction following the launch of the first iPhone in 2007.
In the initial AI adoption phase, immediate beneficiaries include the semiconductor industry and incumbent large-cap tech companies, which are already highly profitable and generate abundant cash flows that enable them to invest heavily in the AI space. Far more challenging to identify are the opportunities that will emerge from subsequent waves of innovation to spawn new businesses and disrupt existing operators across various industries.
It seems likely to us that these ambitious expectations will reinforce the recent trend of businesses reorienting their capital spending towards “soft investments” as the global economy continues to digitalize and become more efficient by reducing its reliance on physical structures and equipment. In Q2 2023, U.S. business investment in intellectual property reached nearly $1.5 trillion on an annualized basis, more than doubling over the past decade. Since 2010, investment in intellectual property has grown at an annualized rate of 7.5 percent, handily outpacing the 5.7 percent growth rate for overall business investment.
A structural shift towards “soft capex”
Annual U.S. corporate investment spending since 1995 (indexed to 1/1/95 = 100)
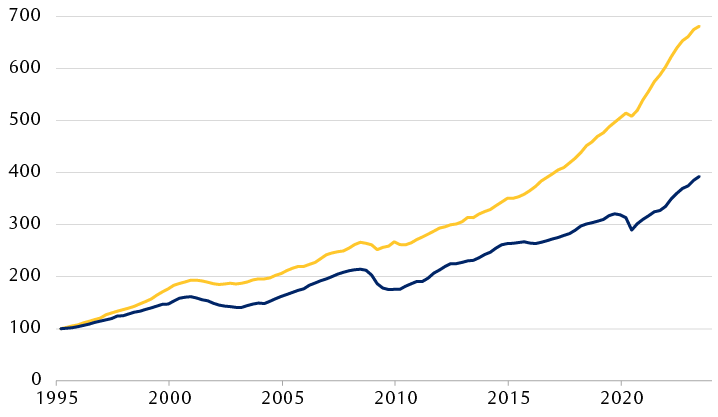
Line chart showing the trend in overall U.S. nonresidential investment and U.S. nonresidential investment on intellectual property products since 1995. The two data series are indexed to 100 on January 1, 1995. Intellectual property investment has increased faster than total investment since then, reaching an indexed value of roughly 700 compared to roughly 400 for total investment.
Source - RBC Wealth Management, Bloomberg; data through 6/30/23
Disruptive technologies in an investment context
This year’s equity market advance has been driven predominantly by a few stocks on the back of mounting excitement related to the AI theme. Some of this enthusiasm toward tech-oriented companies appears well founded; we see many large-cap firms in this space as well resourced and fundamentally sound, a view underscored by their strong balance sheets, consistent growth, and robust profitability. In our view, reliably strong cash flow generation afforded by sustainable competitive advantages has positioned such firms to reap more benefits from the evolution of AI than their peers, at least in the early stages.
All the same, the top-heavy nature of this year’s equity market gains means many investors holding diversified portfolios are sitting on returns that aren’t keeping pace with broad market-cap-weighted indexes, whose values are greatly influenced by the performance of their largest constituents.
In times when the stock market is infused with captivating narratives, there is a tendency for investor expectations to overshoot, and upward momentum in the share prices of perceived beneficiaries can be more powerful and enduring than some investors may consider rational. Historical market cycles show the feedback loop that drives an influx of capital towards certain stocks as they ascend to ever-greater heights can also work in the opposite direction.
While we recognize the transformative potential of widespread AI adoption to enhance the long-term growth trajectory for the economy and corporate earnings, the magnitude and timing of these developments are inherently unpredictable and uncertain. Laying the foundations for novel technologies, upon which new applications, products, and services can be built and monetized sustainably, often requires more time than initially anticipated by investors.
The potential concentration of control over AI platforms could also provoke regulatory scrutiny. Furthermore, AI is surrounded by a plethora of thorny issues including data privacy, copyright, amplification of social biases, and the phenomenon of “hallucinations”—when an AI model generates content that appears highly plausible and persuasive despite having no basis in reality.
It is also worth bearing in mind that even the largest companies can see their once-dominant index shares fade over time, as new frontrunners emerge across subsequent economic cycles. Ascending to the top echelon in any decade does not ensure continued success in the next.
Leaders from every era tend to feel the pull of gravity
S&P 500 Index
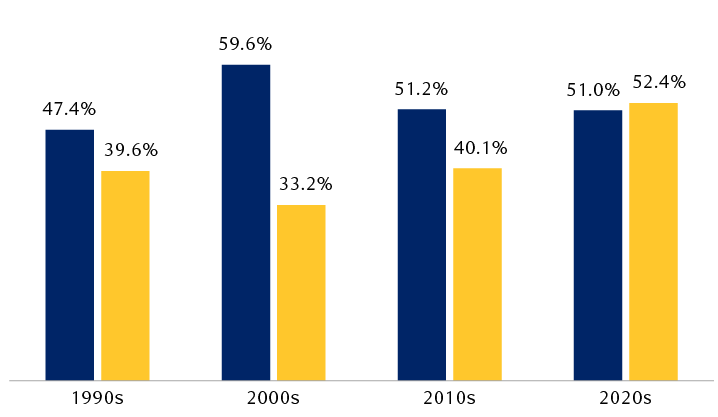
Column chart showing the combined weight of the top 50 companies in the S&P 500 at the start of each decade, and the combined weight of the same 50 companies at the end of the decade, for the 1990s, 2000s, 2010s, and 2020s (through September 30, 2023). The end-of-decade totals are smaller for the 1990s, 2000s, and 2010s; the decade-to-date total is slightly higher for the 2020s. 1990s, 47.4% vs. 39.6%; 2000s, 59.6% vs. 33.2%; 2010s, 51.2% vs. 40.1%; 2020s, 51.0% vs. 52.4%.
Source - RBC Wealth Management, Bloomberg; data for the 2020s through 9/30/23
We firmly believe that AI is an important investment theme with a multiyear runway. But, as has been the case with previous innovations, we also think it is likely that some excesses tied to AI themes will manifest in equity markets along the multi-decade path of adoption and monetization. With the U.S. and global Information Technology sector now trading at a 30 to 50 percent premium valuation to the broader market, the market seems to have factored in the prospect of amplified profit growth. While it is not unreasonable, in our view, for disruptive technologies to garner premium valuations, we would point out that highly valued companies must constantly demonstrate and defend their competitive edge to retain these valuations. The AI arms race appears to have set off a capital spending boom, though which companies will see their capital allocations pay off in profits—and when—remains an open question.
A recent rally vaulted Tech valuations to significant premiums
Relative forward price-to-earnings ratios of the Information Technology sector vs. the broad market
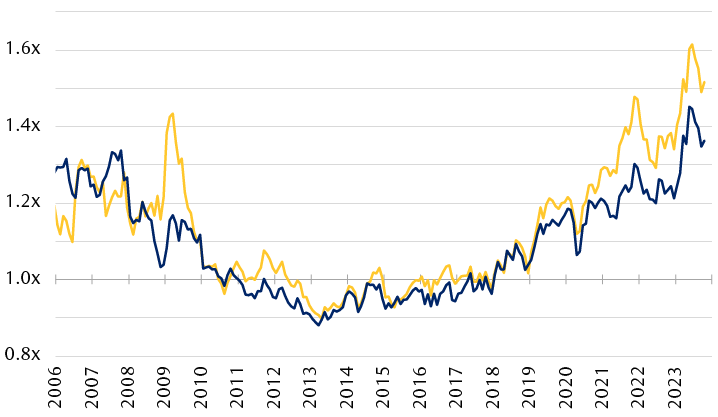
Line chart showing the relative forward price-to-earnings ratio of the global and U.S. Information Technology sectors vs. the MSCI All-Country World Index and S&P 500 Index, respectively, since 2006. Current valuation multiples are approximately 1.5x (global) and 1.36x (U.S.).
Note: Based on the S&P 500 Information Technology Index relative to the S&P 500 Index (U.S.) and the MSCI ACWI Information Technology Index relative to the MSCI ACWI (global).
Source: RBC Wealth Management, Bloomberg; data through 10/19/23
We note that consensus forward-12-month earnings forecasts for global equity markets are not much higher today than they were at the start of the year. This implies that most of the stock market gains in 2023 have been powered by an expansion in valuation multiples. The same holds true for the global Information Technology sector, which now trades at roughly 25x forward-12-month earnings estimates, up from just under 20x coming into the year.
Corporate earnings growth may have a more difficult time living up to the heavier dose of optimism now embedded in stock prices. For this valuation expansion to be validated, generative AI must not only revolutionize businesses but also translate positive investment sentiment into sustainable earnings streams.
Keep a broader perspective
Against this year’s backdrop of narrow leadership, we would emphasize the importance of a disciplined approach to diversification within equity portfolios. Admittedly, diversification can prove frustrating at times because it entails a tradeoff between risk and return. Maintaining a properly diversified portfolio essentially means always owning some assets that are underperforming, but this exposure to less-popular market segments can bolster portfolio performance when market leadership eventually rotates—as it often does.
This approach can help investors guard against potential unintended risks (and unpleasant surprises) stemming from an undue concentration in a single stock or a cluster of similar holdings, while positioning portfolios to navigate a broader spectrum of possible outcomes over the long term.