- More challenges ahead for the UK economy, but the stock market’s record low valuations present attractive long-term opportunities.
- Despite Gilt supply headwinds, bonds still appear attractive as Gilt yields are at one-year highs and pockets of opportunity in credit still exist.
United Kingdom equities
The UK economy fared better than widely expected by investors in 2024, though the outlook remains subdued with consensus GDP growth of 1.3% estimated for 2025. The likely imposition of U.S. tariffs would negatively impact the UK economy, in our view, but the direct impact may be less than what EU countries may suffer. UK exports to the U.S. are only 2% of GDP, compared to 4% for Germany. Besides, the UK economy is more services-oriented than those of its neighbours.
But from our vantage point, the UK economy is also likely to suffer from an indirect impact. Exports to the EU may decline as the region’s overall growth is restrained by trade uncertainty. Even after Brexit, the EU remains the UK’s most important export market by far, accounting for 42% of all UK exports. Moreover, proposed U.S. tariffs and any potential retaliation may dampen UK business confidence.
The government may not have much room to manoeuvre to offset a tariff-related negative growth shock, having used much of its fiscal leeway in the recent budget. The Bank of England (BoE), with an eye on sticky services inflation, may be reluctant to loosen monetary policy too quickly.
The FTSE All-Share Index tends to perform relatively well during global downturns—not our base case forecast—thanks to its high relative exposure to defensive sectors such as Health Care, Utilities, and Consumer Staples. Conversely, it tends to lag in periods when growth sectors are favoured due to its low exposure to Technology in particular.
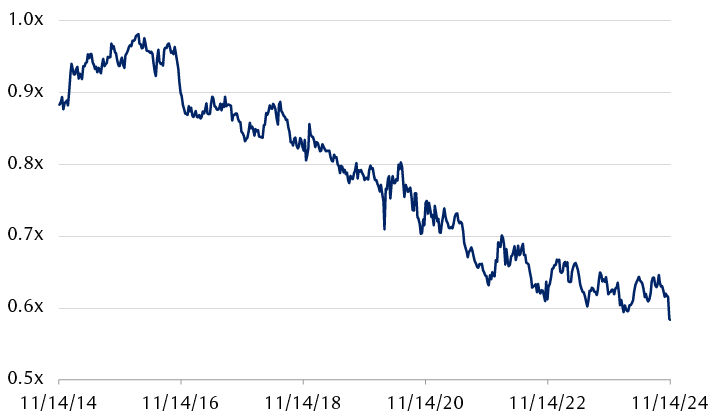
UK valuations remain close to all-time low levels compared to other markets. The FTSE All-Share Index is trading well below its relative long-term median price-to-earnings ratio versus global developed markets, even accounting for sector differences.
UK equities valuation at 10-year low relative to global equities
FTSE All-Share 12-month forward price-to-earnings ratio relative to the MSCI World Index

The line chart shows the valuation of the FTSE All-Share Index relative to the MSCI World Index since November 2014. Since reaching a high of 0.97x in 2016, the relative valuation has steadily declined and is now at a 10-year low of less than 0.6x.
Source - RBC Wealth Management, Bloomberg; data through 11/13/24
Overall, we recommend holding an Underweight position in UK equities, but we believe select quality large caps remain attractive long-term opportunities as they trade at a valuation discount to peers listed in other markets. We favour stocks exposed to UK consumer spending, which should benefit from Bank of England interest rate cuts over the next 12 months.
United Kingdom fixed income
The Bank of England (BoE) is facing more palatable incoming inflation data, albeit with risks lying ahead. According to the Office of Budget Responsibility, the budget will raise GDP growth, but also reignite inflation above the BoE’s target over the 2025–2029 forecast period. Though the BoE refrained from remarking on the effects of stimulative fiscal policy and potential U.S tariffs on the economy, the message was clear in its November projections, in our view. According to the central bank’s forecasts, inflation should return to target in Q1 2027, a year later than suggested in the August estimates.
Markets are pricing in a 4.25% Bank Rate in H1 2025, which seems reasonable if incoming inflation data is broadly in line with the BoE’s forecast. Policy easing could be limited in 2025 if there are persistent upside inflation surprises fueled by tariffs and government spending, relative to BoE forecasts.
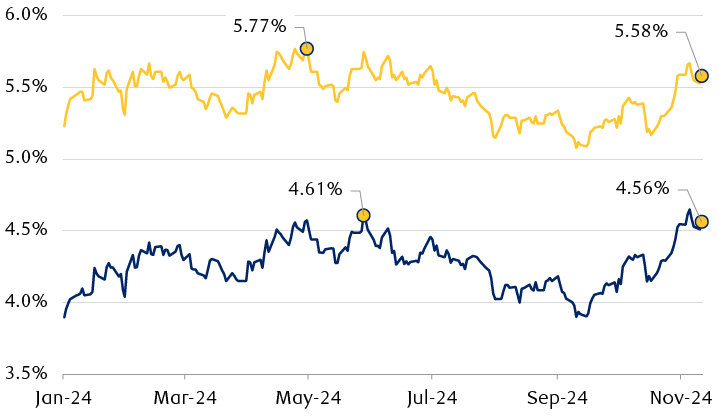
The Debt Management Office’s forecast over the next few years shows that gross Gilt issuance will remain above the historic 10-year averages (excluding 2020, a year with heavy issuances due to the COVID-19 pandemic). Gilt demand remains robust, even with the overhang of £142 billion of additional borrowing on the horizon. We think the fiscal and supply glut risks are largely priced in over the near term, with 10-year Gilt yields at one-year highs, and we have favoured adding duration in portfolios.
Corporate bond yield compensation for duration is around one-year averages, thanks to higher Gilt yields. While all-in yields look compelling to us, spreads have narrowed markedly, shifting further into expensive territory, and we believe the risk of widening from current tight levels is high. A potential headwind lies ahead for corporates that struggle to pass on increased labour costs due to larger employer national insurance contributions and a higher minimum wage. We are cautious and selective on allocations in the near term and favour allocations in Consumer Staples, Industrials, and Financials.
UK bond yields near 2024 peak levels

The line chart shows the yield of the Sterling Aggregate Corporate Index and Sterling Gilts Index from January 2024 through November 2024. Corporate yields are currently at 5.58%, compared to 5.23% in January and a high of 5.77% in May. Gilt yields are currently at 4.56%, compared to 3.90% in January and a high of 4.61% in May.
Source - RBC Wealth Management, Bloomberg; yields represented by the Bloomberg Sterling Aggregate Corporate Index and Sterling Gilts Index; data through 11/13/24

