
We’ve been consistent: It’s hard to bet against the U.S. economy. Major non-residential infrastructure buildouts, a powerful top-income consumer and sizable government spending are keeping the economy on track to grow by more than two percent this year.
The labor market is structurally tight, driven by the ongoing exodus of retirees and reduced immigration. We expect the structural hiring in healthcare to continue, but payroll growth doesn’t send the same signal it once did. We continue to view the unemployment rate as a better indicator of labor market health.
Data over May and June have largely confirmed that the U.S. economy is in a comfortable place as we head into the second half of the year. Tame core inflation measures and strong retail sales mean the worst fears over energy inflation spreading, and/or consumers faltering under high oil prices have not materialized.
At least not yet. Despite our optimistic base case forecast, we continue to monitor for risks in what is an increasingly rosy outlook. We feel confident our forecast is the right one as we take a midyear moment to think critically about our outlook. Still, the tails around risks are getting fatter, most notably the uncertainty created by the Iran war.
Risk #1: A false sense of safety on inflation
Inflation eased as a concern in June. The core measures of consumer and producer prices dramatically decelerated as energy prices subsided. As a result, both consumer and market-based measures of inflation expectations dropped. But it’s increasingly looking as though the June sigh of relief was an anomaly, and July is a reversion to the new trend of sticky inflation with upside risks.
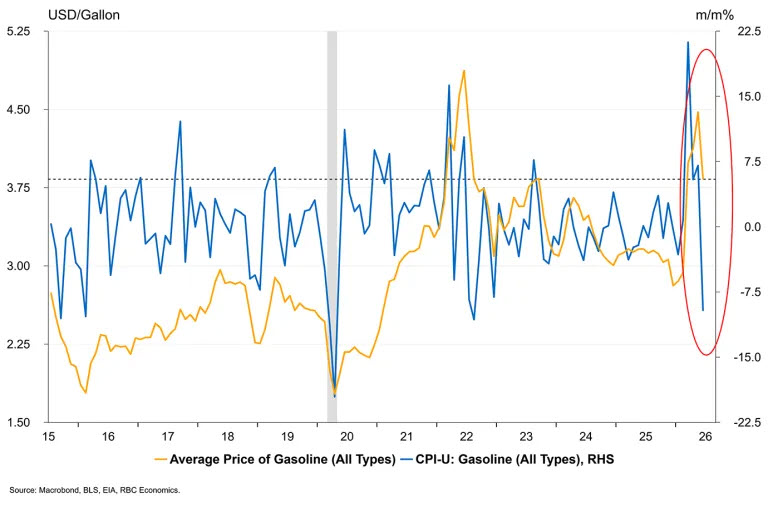
- Most obviously, energy prices have surged higher in the back end of July. At the time of writing, they are fluctuating around $90/barrel. While that is lower than the peak in May, prices are still almost 60 percent higher since the start of the year and nearly 35 percent higher than the start of July. Importantly, while inflation data will focus on month-over-month and year-over-year changes, consumers are more likely to focus on price levels. Average gasoline prices back up above the $4 psychological threshold matters, and the temporary improvements in real wage growth in June will likely retrace.
- The threat of tariffs is back in play, which is disappointing because the peak of tariff pressure on inflation could have been behind us (we had previously expected the peak in Q2). While the implementation of Section 301 tariffs on Canada is likely to have limited impact on our outlook for the U.S., the U.S. administration has indicated it may be applying new tariffs across dozens of countries as temporary global tariffs expire at the end of July. As we’ve covered, tariffs have real impact on goods prices, but with a fairly substantial lag. Tariff refunds provide one-time support to businesses, but they aren’t a permanent fix on an ultimately inflationary policy.
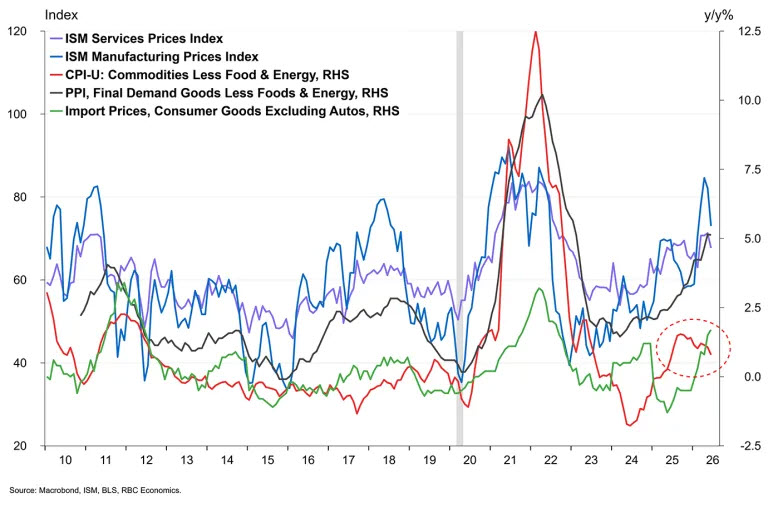
- There are still cost pressures in the pipeline. Producer prices rose 5.5 percent year-over-year in June, and leading indicator of finished consumer goods inflation is elevated at 3.6 percent y/y. The gap between core goods CPI and finished consumer goods PPI suggests consumer prices still face pressure in the pipeline. That doesn’t sound like a massive gap, but the problem for consumers is there are no signs of outright deflation.
The recent trend in core goods CPI trend is the outlier
Risk #2: Labor market resilience is our base case, but not a given
We’re long-time believers that structural forces should keep the U.S. labor market tight (see America needs workers, not jobs ). A shrinking labor force and structural needs for hiring in healthcare mean the unemployment rate in our base case should stick close to 4.3 percent for the remainder of the year. However, there are some yellow flags in some recent employment data that should be monitored, particularly if price pressures reaccelerate and businesses find the need to cut costs.
- The June employment report provided substantial revisions to prior months, which had previously suggested job growth was strong. The three-month average payroll gain collapsed by more than a third. Net revisions to the prior two months subtracted more jobs than were created in June.
- Leisure and hospitality—one of the few bright spots earlier in the year—shed jobs at a pace that reversed the prior month’s gains entirely. The BLS explicitly flagged “weaker than usual seasonal hiring,” the sector has shown no net employment growth in 2026, and the end of the World Cup risks additional layoffs ahead.
- Outside of the two sectors mentioned above, there is little to be excited about from a growth perspective. There are pockets of growth—nonresidential construction is benefiting from the AI boom—but residential construction is declining, and we expect the housing market will remain in a deep freeze . The manufacturing sector is seeing strong growth in terms of industrial production, but much of the growth is concentrated in capital intensive, advanced manufacturing sectors that are not adding jobs meaningfully. Critically, trade exposed sectors will face cost pressures as new tariffs come into play on top of rising energy prices. The recent rebound in trade-exposed sectors could very well end up being short-lived.
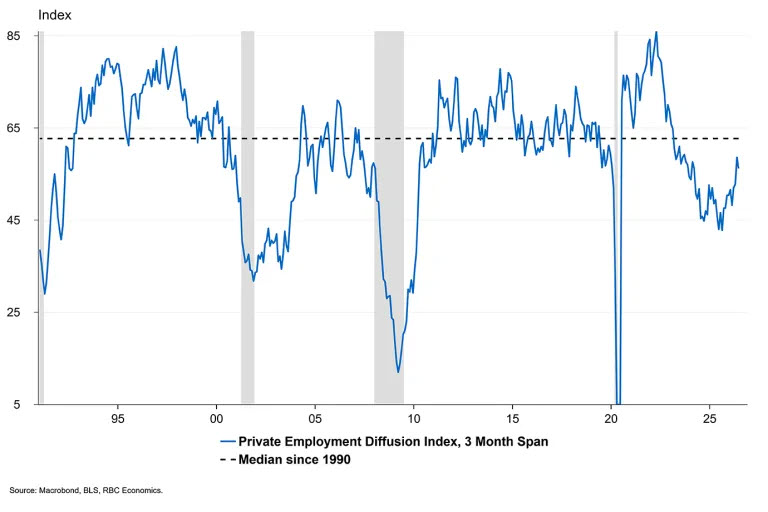
The breadth of payroll gains remains below the median over the past 35 years
Risk #3: Consumers are now more vulnerable to additional shocks
Inflation spikes and labor market wobbles aren’t new, even in the past few years. Consumers have weathered those storms thanks to strong balance sheets, steady employment, strong non-labor income growth and more recently, tax refunds.
Yet heading into the second half of 2026, some of those buffers that served consumers well have worn down. In June, we flagged the declining savings rate and slower growth in real wages as a limit on how fast U.S. consumption can grow. These measures will be increasingly important to monitor as tax refunds have largely been used up on higher gas prices . And let’s not forget, the K-shaped economy is still fully in play . These are longer-term vulnerabilities, not temporary ones, that have become amplified this year.
The U.S. consumer held on over the first half of the year, but any combination of higher inflation, job market weakness and/or a Federal Reserve that responds with higher interest rates risks a more pronounced reaction from the consumer than what we’ve become accustomed to since the pandemic.
Levels matter and gas prices around $4 per gallon don't help the consumer
Growth outlook
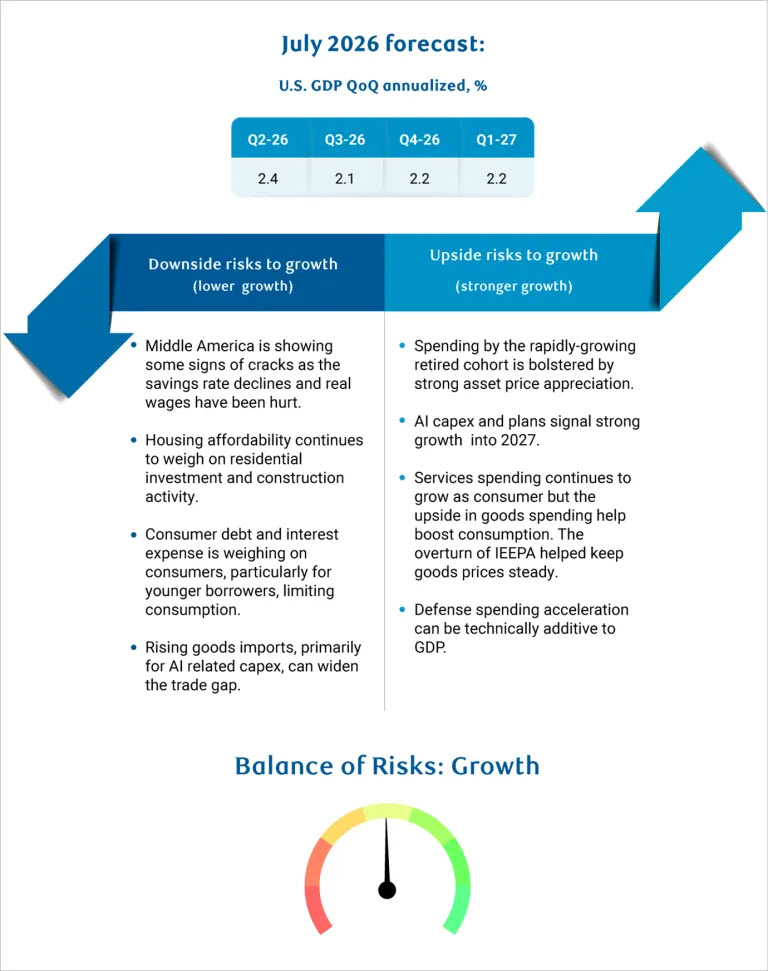
House view: U.S. economic resilience continues, with underlying growth slightly above the two percent trend, though diverging trends persist beneath it. AI continues to drive the entirety of the business investment story: spending on information processing equipment and data center infrastructure has surged, while CAPEX outside of the AI remains exceptionally weak. On the consumer side, there are signs that consumer buffers in Middle America are developing cracks worth monitoring. With energy prices rising once again, we view risks to the economy as roughly balanced, with downside surprises still possible should another inflationary shock rear its head and upside surprises still possible from productivity and the AI investment boom.
Inflation outlook
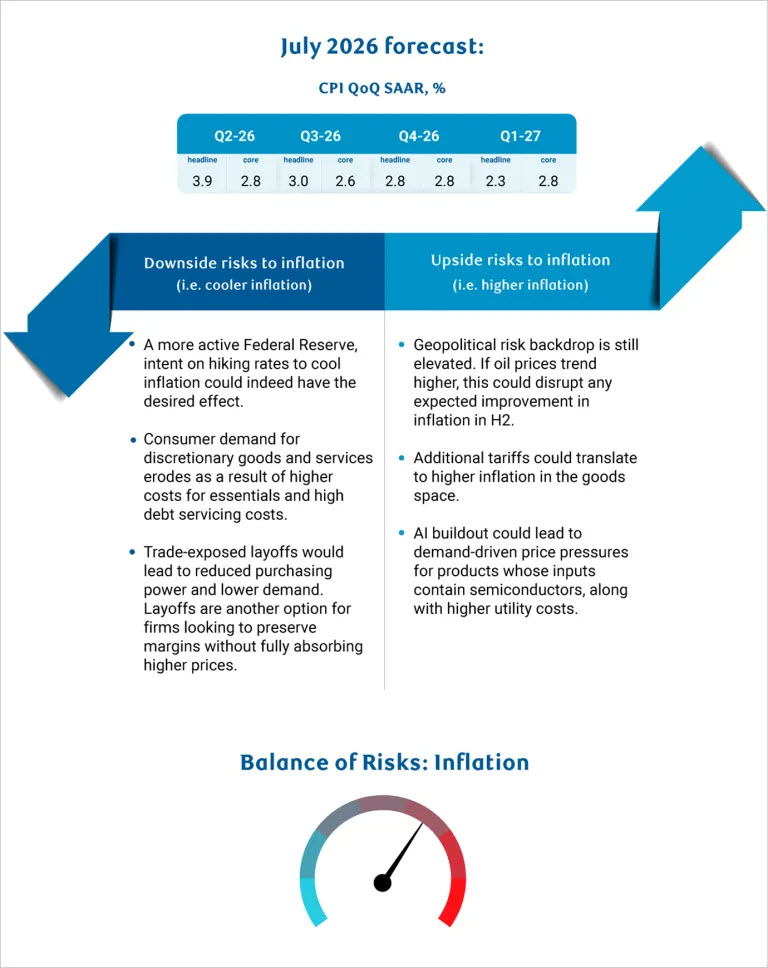
House view: Even as energy prices settle, inflationary pressures remain broad and persistent. Housing inflation is still running hot, strong wage growth continues to put a floor under core services, and tariff passthrough to core goods is still likely coming through the pipeline—as evidenced by the gap between PPI and CPI. We expect core inflation to settle just below three percent by year-end. The new wrinkle in our outlook is incoming Federal Reserve Chair Kevin Warsh who has decidedly positioned the central bank as keen to return inflation back to the two percent target. Should the Fed begin hiking again, the heat under inflation may be more contained.
Labor market outlook
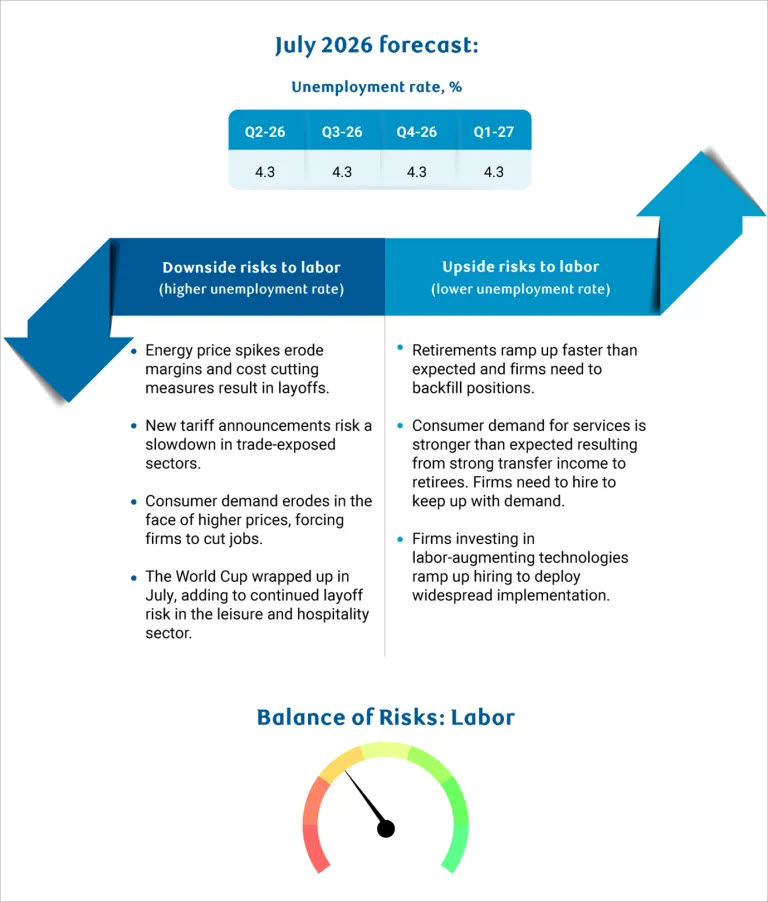
House view: We continue to expect both structural factors will keep the U.S. labor market very tight even with some cyclical weakness. Monthly hiring in the U.S. labor market has outpaced expectations—especially in the context of exceptionally low breakeven employment. But recent payroll growth has been revised lower, and the breadth of hiring is still well below the 30-year median. Employment in white-collar sectors remains in decline, contributing to a significant skills-matching problem facing new graduates. Real wage growth improved in June, but a reversal means the risk of demand destruction has not fully dissipated.
About the authors:
Frances Donald is the chief economist at RBC and oversees a team of leading professionals, who deliver economic analyses and insights to inform RBC clients around the globe. Frances focuses on economic issues and is highly sought after by clients, government leaders, policy makers and media in the U.S. and Canada.
Mike Reid is head of U.S. Economics at RBC. He is responsible for generating RBC’s U.S. economic outlook, providing commentary on macro indicators, and producing written analysis around the economic backdrop.
This article was originally published on RBC Economics .