U.S. equities
Despite significant volatility in the spring caused by ultra-high tariffs – including an S&P 500 selloff of nearly 19 percent – major U.S. indexes are now close to where they were when the year began.
The worst of the tariff volatility seems to us like it’s blown over. RBC Global Asset Management estimates the U.S. average effective tariff rate will end up between 13 percent and 15 percent, far lower than the 22 percent to 27 percent range before the Trump administration backed away from sky-high tariffs. But 13 percent to 15 percent is still elevated enough to generate economic headwinds and uncertainties given this would be the highest rate since 1941 and is well above the 2.4 percent level in 2024.
Below-average GDP growth the likes that RBC Economics is forecasting – 1.6 percent in 2025 and 1.3 percent in 2026 – could mean that S&P 500 earnings end up growing more moderately than the consensus forecast. RBC Capital Markets anticipates earnings of $258 per share in 2025, which translates into 4.5 percent y/y growth, below the consensus forecast of $265 per share and 7.5 percent growth. With Fed rate cuts potentially resuming in the autumn and picking up pace next year, we think investors’ attention will soon focus on 2026 earnings prospects. While the consensus growth forecast seems too high to us, even moderate growth in 2026 could help support the market so long as recession risks don’t rise meaningfully.
Wall Street will continue to keep an eye on Washington policies, but they will likely have less impact on the market than during the tariffs saga. We think Senate and House Republicans will be forced to ultimately craft compromises on the “One Big Beautiful Bill Act” out of political necessity – although the process could get very messy. It’s our sense that the market has already largely priced in the pro-consumer tax provisions and the pro-business incentives within the bill.
Given the lingering economic and earnings growth risks, along with stretched valuations, we continue to recommend investing in U.S. equities up to but not above a normal, Market Weight level. We still favor dividend growth stocks and like Technology stocks.
Earnings growth likely below consensus forecasts
S&P 500 past year-over-year earnings growth (dark blue) and consensus forecast (light blue)
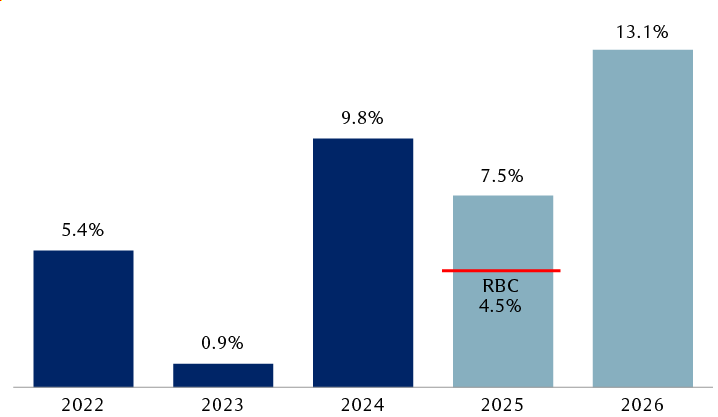
The bar chart shows year-over-year earnings growth for the S&P 500 from 2022 through 2024, and consensus estimates for 2025 and 2026 as of June 2025. Earnings grew 5.4% in 2022, 0.9% in 2023, and 9.8% in 2024. The consensus forecast is for earnings to grow 7.1% in 2025 and 13.5% in 2026. RBC Capital Markets predicts lower growth of 4.5% in 2025.
Source - Bloomberg (past earnings growth and consensus forecasts for 2025 and 2026), RBC Capital Markets U.S. Equity Strategy (2025 forecast of 4.5 percent); data as of 6/16/25
U.S. fixed income
The Fed has taken a wait-and-see approach through the first half of the year, but we expect the second half to provide more seeing than waiting. We believe the Fed will continue to assess the incoming labor market and inflation data over the summer, but we anticipate further cooling in the former as likely to set the stage for another round of modest policy easing, beginning with a first rate cut as early as September.
The benchmark 10-year Treasury yield remains a key market and economic signal for investors. Over the past year it has traded roughly in a 3.75 percent to 4.75 percent range, ending May around 4.50 percent. Should its yield break above 4.75 percent, that could be a sign of renewed inflationary and/or budget deficit risks; levels below 3.75 percent have typically coincided with economic growth and recession fears. We expect that range to hold, but with softer economic activity expected later this year, we see a modest decline toward 4.00 percent.
Despite heightened volatility, bonds have provided a semblance of stability. Both Treasuries and investment-grade corporates have delivered positive returns for the bulk of the year, while the municipal bond market has lagged notably. As the chart shows, munis were down four percent at one point in April on a one-two combination of tariff-related volatility and rising fears the asset class was at risk of losing its tax-advantaged status. Though those fears have faded, the continued underperformance may offer entry points for muni investors to put money to work.
Though municipal bond valuations remain relatively inexpensive, corporate bond valuations are once again historically expensive. Over the past 25 years, corporate bond investors have, on average, been paid an additional 1.5 percent in yield over comparable Treasuries; after the market recovery since April, that yield advantage is barely half that at just 0.8 percent. Therefore, corporate bonds may now offer more downside risk than upside potential but, absent a recession, we expect them to perform similarly to Treasuries into the end of the year.
U.S. bond market performance in 2025: A mixed bag
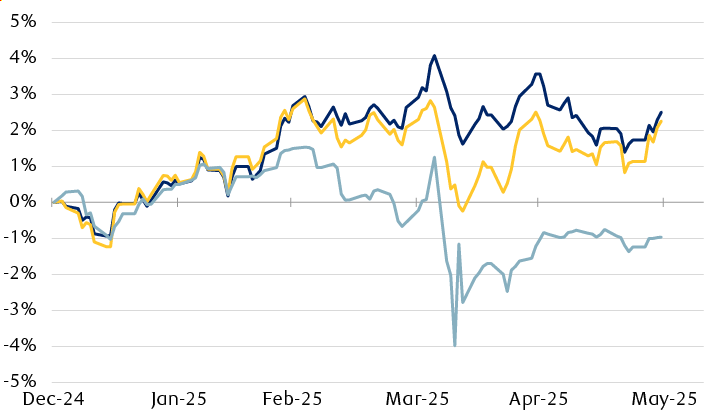
The line chart shows the 2025 performance of major U.S. bond market indexes. Treasuries have returned 2.5%, investment grade corporates 2.3%, and municipals have declined by 1.0%.
Source - RBC Wealth Management, Bloomberg Indexes; data as of 5/30/25