In the last technical update for the Global Insight Weekly on May 29, we noted that the weekly momentum indicators (top panel in the chart), tracking 3–6+ months swings, suggested further upside for equities potentially to new highs before they become overbought and peak by mid Q3. Those momentum indicators are now overbought and turning down following a 30+% rebound by the S &P 500 from the oversold levels that developed at the April lows.
S &P 500 with weekly momentum and advance-decline line
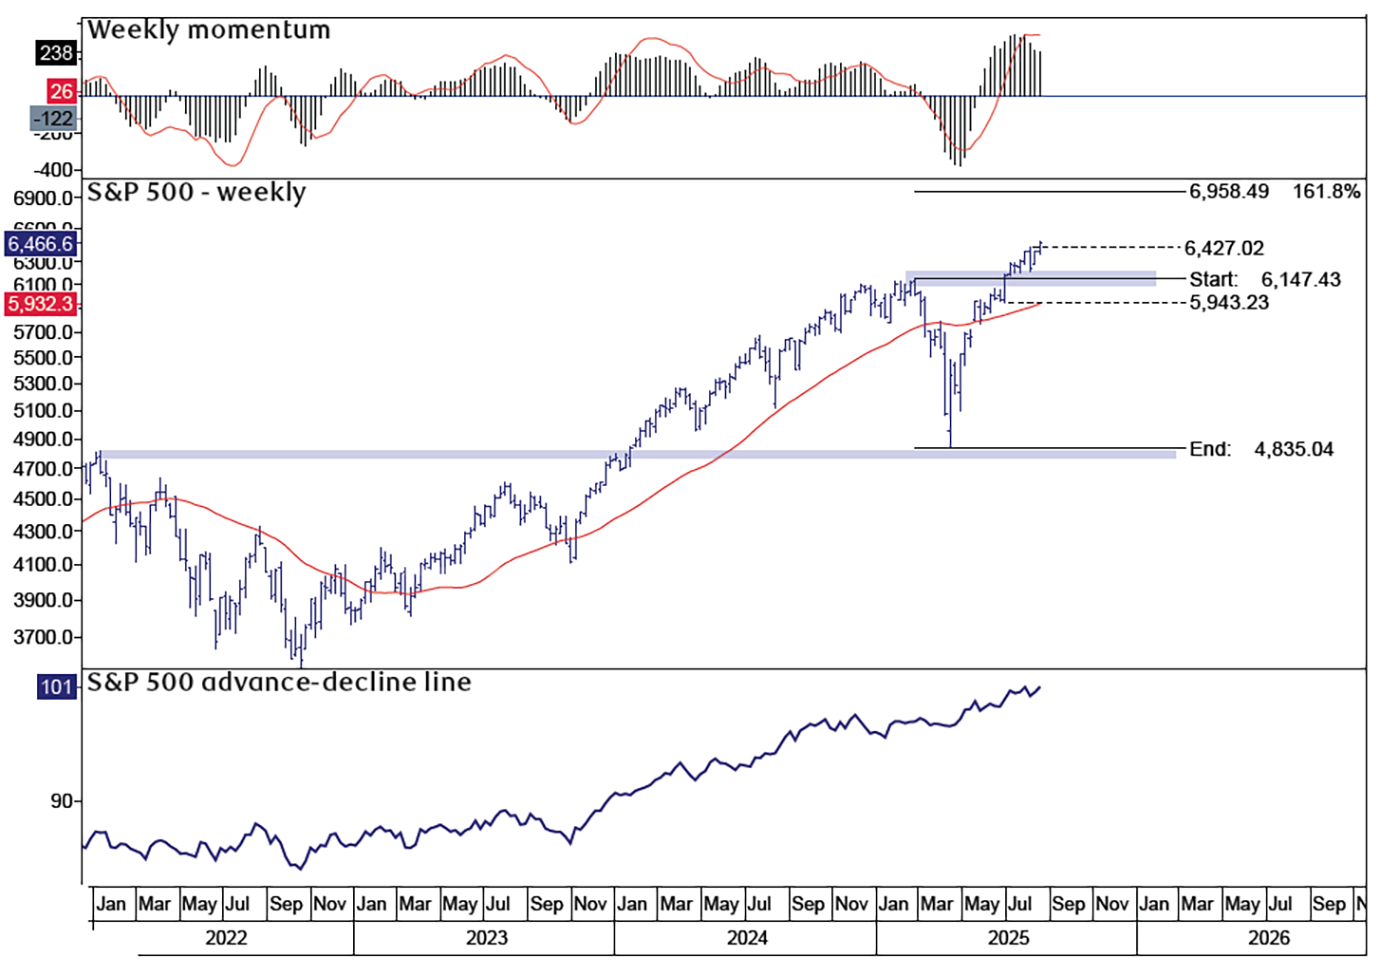
Source –RBC Wealth Management, Bloomberg, Optuma
Tapping the brakes after a strong rebound – Although the S &P 500’s uptrend remains intact notching all-time highs this week, we expect the balance of Q3 moving into Q4 to be more challenging given:
- The S &P 500 along with the leading large-cap growth stocks are becoming well advanced from an intermediate-term (3–6 months) technical perspective while many of the growth and cyclical stocks (notably Industrials and Financials) that led the rebound have started to pause and pull back as they report earnings for the prior quarter. These pullbacks may prove to be short-term in duration, but with weekly indicators turning down following strong rebounds through Q2, we expect further choppy trading through the balance of Q3.
- Market capitalization is increasingly concentrated in a handful of stocks with the largest two stocks accounting for 15% of the S &P 500, the highest since 1980, and the largest four stocks accounting for 25% of the index. Put differently, while the uptrends for these stocks remain firmly intact reflecting strong fundamentals, sustained upside by the S &P 500 is dependent on just a few high-momentum, high-valuation stocks with any hiccups in their optimistic outlooks likely to result in the S &P 500 pulling back.
- Seasonality often turns negative for equities moving through Q3 into early Q4, which is also a pattern that is common in the first year of a new U.S. administration.
- Lastly, while valuation is not a focus for us technically, our fundamental colleagues are increasingly concerned that valuations appear to be stretched for many growth stocks.
Incrementally cautious but not bearish – To be clear, technically we are not bearish given the underlying trend remains positive, but we are finding relatively few timely opportunities in the leading sectors following the S &P 500’s impressive surge since April. In short, we view this backdrop to support a cautious approach to chasing advanced leaders and to be more selective allocating capital to equities.
Consider rebalancing portfolios – While we appreciate many technical trend-following investors are comfortable adding capital in strong uptrends, we are focused on preserving investor capital and prefer diversifying exposure from well advanced groups and stocks to those that are showing signs of either bottoming or emerging after months of sideways trading. Sector and group rotation is often the lifeblood of a bull market wherein a leading group pauses while lagging areas rebound to fill the leadership vacuum. In short, we encourage investors to consider rebalancing portfolios following the strong equity rebound.
A few lagging groups are improving – While we don’t see a major shift away from the leading growth and artificial intelligence stocks, we are seeing select groups that have lagged through 2025 showing signs of improvement. Homebuilders is one area we have focused on regularly over the past two months with biotech another area showing signs of emerging.
U.S. 30-year yield and U.S. 10-year yield (weekly)
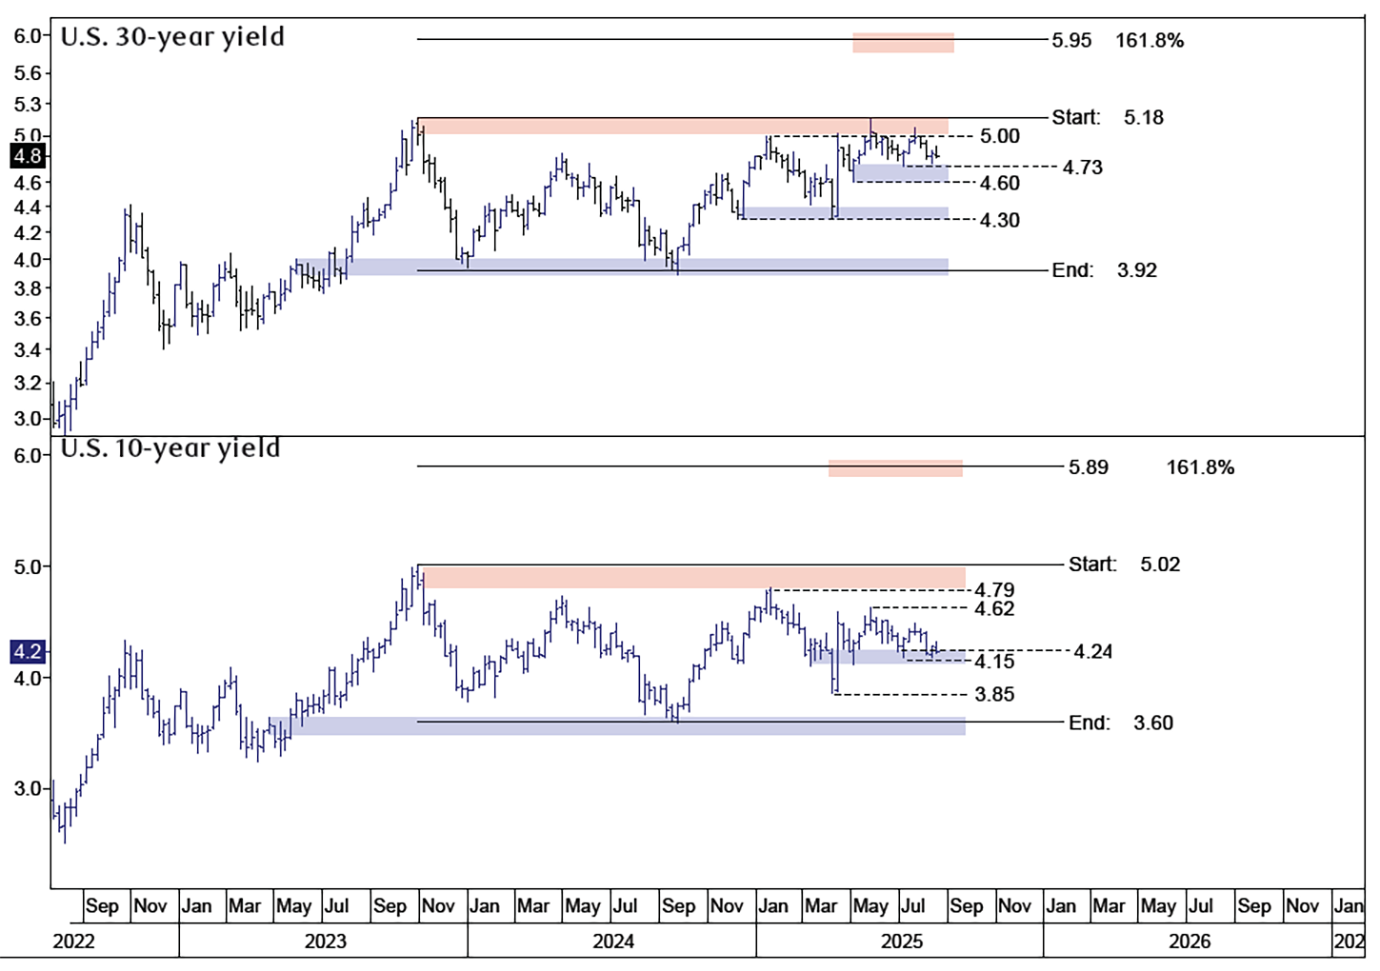
Source –RBC Wealth Management, Bloomberg, Optuma
A technical perspective of interest rates – While we have only highlighted two industry groups above as emerging ideas, both are sensitive to the direction of interest rates which brings us to the chart above showing U.S. 30-year and U.S. 10-year yields. Although inflation concerns remained a risk at the end of May, interest rates have cooled, pulling back to test their next downside technical levels at 4.6%–4.7% for the U.S. 30-year Treasury yield and 4.15%–4.24% for the U.S. 10-year Treasury yield. The bottom line is that we see the technical backdrop for long-term interest rates as likely to remain range bound/neutral into Q4 with a move above 5.00%–5.15% for the U.S. 30-year Treasury yield and above 4.6%–4.7% for the U.S. 10-year Treasury yield needed to signal that long rates are starting a new major up leg. Given the recently improved behavior of a growing list of interest-rate sensitive equities, such as homebuilders, biotech, banks, and small-caps, our expectation is for long-term interest rates to remain in a flat to weaker range through Q3 with those industries signaling the potential for an interest rate cut by the Federal Reserve in September.