

Equity trends remain positive
Despite a lengthy list of concerns from valuations and narrow market concentration in mega-cap technology stocks to inflationary implications of the Middle East conflict, the technical trend of the S&P 500 remains positive, with a healthy breadth of participation across sectors. We view the current technical backdrop to be supportive of remaining invested in equities while acknowledging potential risks, notably trends in long-term interest rates and the potential for seasonal weakness moving through Q3 into Q4.
Yellow flags or just a normal pause?
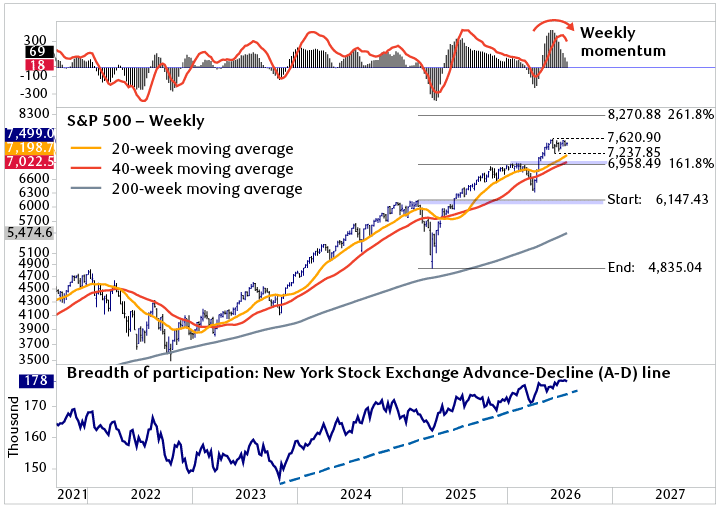
From a multi-month tactical perspective, global equity markets have stalled over the past few weeks, with the S&P failing to break out above its June highs at 7,620 but holding above its first support near 7,200 and rising 20-week moving average. Weekly momentum indicators, tracking 2–4+ month swings, have turned down from overbought levels. While a cautionary signal, it is not uncommon for these indicators to turn down weeks or even months ahead of a market pullback. Until the S&P breaks below its first support level near 7,200, we view the current choppy trading to be a normal pause that consolidates the prior quarter’s 20 percent rebound. Moving into mid-late Q3, however, we expect normal seasonal weakness to develop in the lead-up to U.S. midterm elections.
S&P 500 weekly (Sept.2021–July 2026) with 20-, 40-, and 200-week moving averages, weekly momentum, and NYSE Advance-Decline line
Source - RBC Wealth Management, Bloomberg, Optuma
The chart shows technical indicators for the S&P 500 on a weekly basis since late 2021: the index value along with 20-week, 40-week, and 200-week moving averages; weekly momentum; and the advance-decline line (the difference between the number of advancing and declining stocks). The S&P 500 Index has recently appeared to stall, failing to break out above its June highs at 7,620 but holding above its first support level near 7,200 and its rising 20-week moving average. Weekly momentum has turned lower over the past several weeks. The advance-decline line continues its general upward trend since the end of 2023.
No bad breadth here … yet
Breadth of participation, as measured by the New York Stock Exchange (NYSE) Advance-Decline (A-D) line, remains in a strong uptrend and near all-time highs. In general, breadth begins to decay weeks to months in advance of a market peak, so a strong NYSE A-D line is encouraging. It is worth highlighting that while the S&P 500 bottomed in Q4 2022, the NYSE A-D line bottomed a year later in Q4 2023, which coincided with U.S. long-term interest rates peaking and beginning their sideways trend into 2026. Our interpretation is that the A-D line reflects how most stocks outside mega-cap growth stocks are sensitive to the direction of interest rates, so it serves as a useful barometer of the internal health of the equity market.
Two noteworthy equity themes
Within equity markets, there are two areas for investors to monitor closely. First, the behavior of semiconductors—which are at the heart of the AI infrastructure buildout—remains a barometer for investors’ risk appetite. After a 100+ percent rally in Q2 on the back of surging fundamentals, semiconductor indexes declined 20 percent in just three weeks, returning to short-term oversold levels. While we are not expecting a surge similar to what developed in Q2, an oversold rally is likely underway that we expect will support higher momentum areas within the equity market. The recent lows now serve as an important demarcation line with a break below those levels needed to signal a deteriorating risk appetite for the dominant leadership in the equity market. Outside of dominant technology and growth leadership, we view the technical profile for many energy and materials stocks to be positive following Q2 corrections and an area for investors to consider as part of an inflation hedge within portfolios.
Long-term interest rates are challenging important upside technical levels
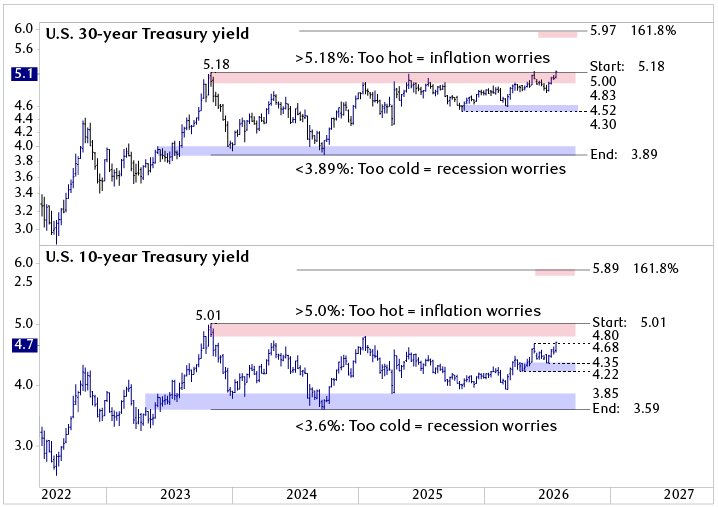
U.S. 30-year and 10-year Treasury yields remain range-bound but are testing important upside technical levels
Source - RBC Wealth Management, Bloomberg, Optuma
The chart shows the U.S. 30-year and 10-year Treasury yields since mid-2022. The 30-year Treasury yield is now around 5.18%, a level it reached in 2023 and again in the first half of 2025; above this level, it could be considered too hot, triggering inflation worries. Conversely, a level below 3.89% (which it last touched in the second half of 2024) could be considered too cold, triggering recession worries. The 10-year yield is currently near 4.68%; a level above 5.0% could be considered too hot, triggering inflation worries, while a level below 3.6% (which it last touched in the latter half of 2024) could be considered too cold, triggering recession worries.
We view the direction of interest rates to be one of the more important catalysts for the equity bull market that bottomed in Q4 2022 and accelerated in Q4 2023 when U.S. long-term interest rates peaked. Since Q4 2023, the U.S. 30-year and U.S. 10-year Treasury yields have been well behaved, trading in sideways ranges with equity markets trending higher. While we expect this trading range to continue in Q3, we would view a breakout above that range as a signal that inflation concerns are accelerating with equity market breadth and price trends likely turning negative.
Important upside technical threshold for U.S. long rates
We have highlighted in red and blue the upper and lower bands that we view to be technically important, with the U.S. 30-year Treasury yield challenging a key level between 5.0 percent and 5.18 percent, while the key levels for the more widely followed U.S. 10-year Treasury yield start at 4.7 percent followed by a critical band between 4.8 percent and 5.0 percent. On the downside, a move below 4.8 percent by the U.S. 30-year Treasury yield would be needed to signal a reversal of the uptrend that began in the summer of 2025, with 4.5 percent as the next key level. For the U.S. 10-year Treasury yield, 4.2 percent remains an important short-term floor.