Key points
- Big Tech’s unprecedented expansion in AI infrastructure, funded by internal cash, tests the limits of sustainable growth.
- A decade-high capex-to-revenue ratio suggests a departure from asset-light models but introduces new risks and opportunities in the AI era.
- As the evolving narrative of AI adoption deepens, greater emphasis moves to monetization and tangible applications.
Full steam ahead
The launch of ChatGPT in late 2022 unleashed one of the fastest and largest capital expenditure (capex) cycles in decades. At its core is the infrastructure needed to train and deploy AI at scale—semiconductors, networking equipment, power systems, and data centres. Leading the investment boom are the dominant U.S. Big Tech firms vying to establish leadership in what is increasingly viewed as a transformational general-purpose technology.
Capex among these firms has more than doubled in the last two years, reaching $427 billion in 2025. Momentum shows few signs of fading heading into 2026, with projections pointing to a further 30 percent year-over-year increase to roughly $562 billion. This spending is unevenly distributed, however, with Microsoft, Amazon, Alphabet, Meta and, more recently, Oracle accounting for the bulk of the increase.
Big Tech capex continues to increase
Annual capital expenditures by Big Tech companies (USD billions)
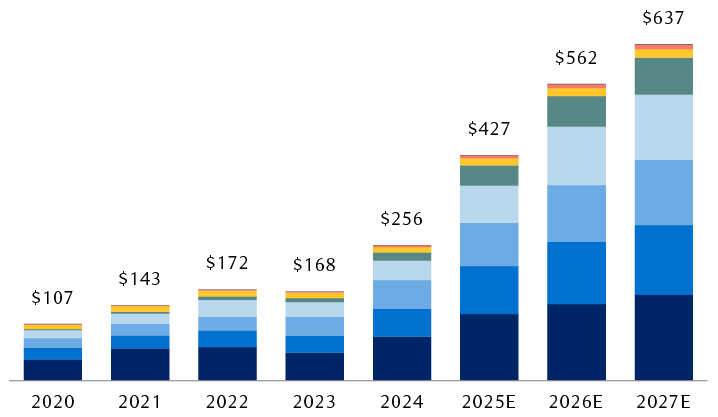
Source - RBC Wealth Management, Bloomberg; data as of 1/28/26; 2025 and later data are Bloomberg consensus estimates
The column chart shows annual capital expenditures by eight “Big Tech” companies (Alphabet, Amazon, Apple, Broadcom, Meta Platforms, Microsoft, Nvidia, and Oracle) from 2020 through 2024 and consensus estimates for spending in 2025, 2026, and 2027. Total spending was $107 billion in 2020, $143 billion in 2021, $172 billion in 2022, $168 billion in 2023, and $256 billion in 2024. Estimated spending is $427 billion in 2025, $562 billion in 2026, and $637 billion in 2027. The largest expenditures in all years were made by Amazon, Alphabet, Meta Platforms, and Microsoft, and spending by these four companies has increased significantly in every year since 2024.
Capex sustainability
For now, we believe these companies are broadly operating from a sturdy financial position, underscored by cash-rich balance sheets and reliable cash flow generation. As of the third quarter of 2025, these companies held cash and equivalents totalling $490 billion and generated nearly $400 billion in trailing 12-month free cash flow after capex outlays, implying most of the current AI-related spending has been funded by internally generated cash, rather than through external sources of financing such as debt.
Cash-rich corporate balance sheets support AI-related spending
Total trailing 12-month free cash flow of Big Tech companies* (USD billions)
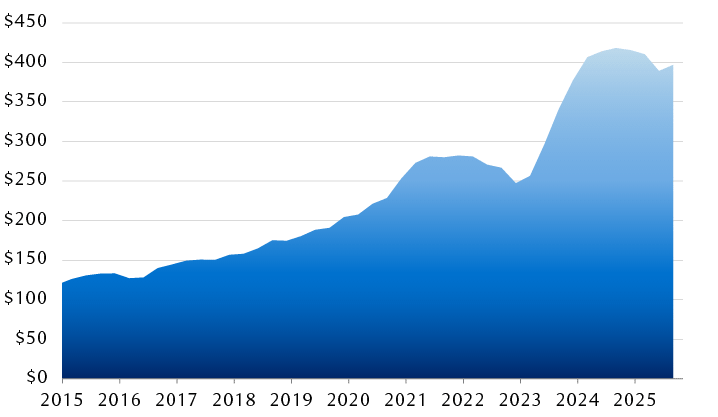
Source - RBC Wealth Management, Bloomberg; quarterly data through 9/30/25. * Amazon, Alphabet, Microsoft, Meta Platforms, Oracle, Apple, Nvidia, Broadcom.
The chart shows total trailing 12-month free cash flows of Big Tech companies (Alphabet, Amazon, Apple, Broadcom, Meta Platforms, Microsoft, Nvidia, and Oracle) since 2015. Free cash flow increased steadily from around $100 billion in 2015 to roughly $275 billion in 2021, then dropped slightly through mid-2023 before moving sharply higher to above $400 billion in mid-2024. Free cash flow remained near $400 billion as of the third quarter of 2025.
While this strong self-financing capacity suggests to us that the current level of investment can be sustained in the near term, it is also tethered to the group’s fundamental outlook. A meaningful slowdown in earnings growth could heighten scrutiny and test the market’s tolerance for continued elevated spending, in our opinion. Consensus expectations point to Big Tech’s earnings growth of roughly 22 percent in 2026 and 2027, continuing to outpace the broad market, though by a narrowing margin.
Big Tech retains an earnings edge
Average annual EPS growth rate of Big Tech companies*
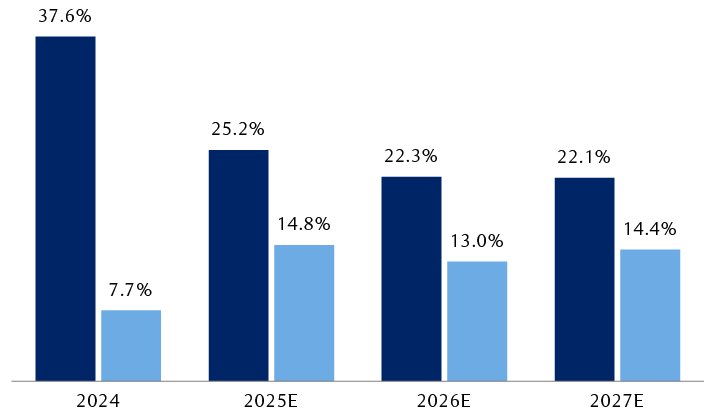
Source - RBC Wealth Management, Bloomberg; data through 1/21/26; 2025 and later data are Bloomberg consensus estimates. * Amazon, Alphabet, Microsoft, Meta Platforms, Oracle, Apple, Nvidia, Broadcom.
The column chart compares the annual rate of earnings-per-share (EPS) growth for Big Tech companies (Alphabet, Amazon, Apple, Broadcom, Meta Platforms, Microsoft, Nvidia, and Oracle) to that of the S&P 500 as a whole. In 2024, Big Tech EPS grew 37.6% and S&P 500 EPS grew 7.7%. For 2025, estimated EPS growth is 25.2% for Big Tech and 14.1% for the S&P 500; for 2026, 22.5% for Big Tech and $13.7% for the S&P 500; and for 2027, 21.8% for Big Tech and 14.1% for the S&P 500.
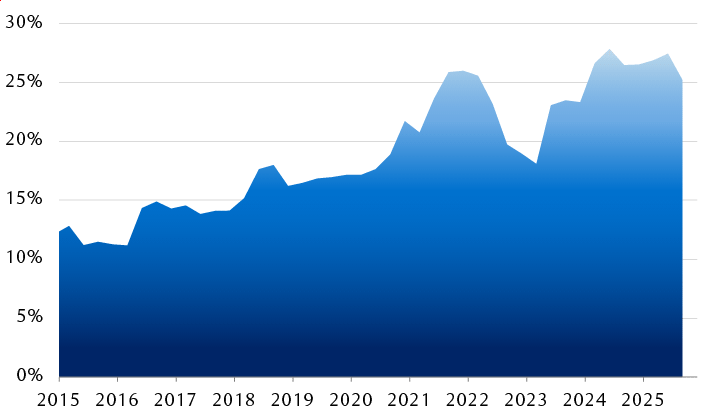
Rising capex intensity
Another trend worth monitoring is capital intensity. Big Tech’s capex as a share of revenue has risen to its highest level in over a decade. This marks a notable departure from the asset-light and capital-efficient business models—monetizing and scaling through some combination of intellectual property, software, algorithms, advertising, platforms, and network effects while spending relatively little on physical assets—that supported premium valuations over the past decade.
Capital intensity has reached decade-high levels
Median capex-to-sales ratio of Big Tech companies*
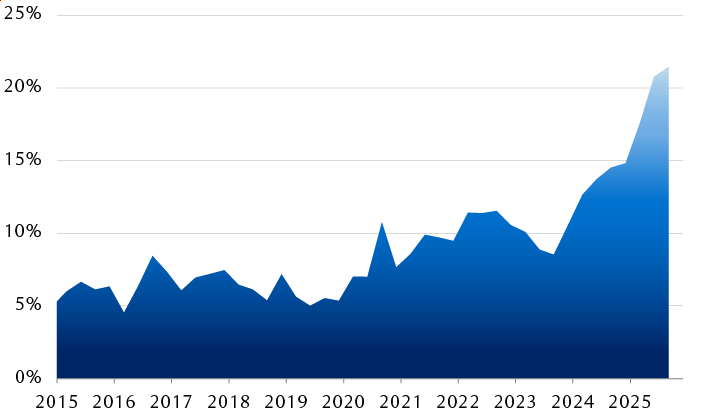
Source - RBC Wealth Management, Bloomberg; quarterly data through 9/30/25. * Amazon, Alphabet, Microsoft, Meta Platforms, Oracle, Apple, Nvidia, Broadcom.
The chart shows the median ratio of capital expenditure to sales for Big Tech companies (Alphabet, Amazon, Apple, Broadcom, Meta Platforms, Microsoft, Nvidia, and Oracle) since 2015. The ratio was generally around 10% until late 2023, when it began a rapid increase to more than 20% as of the third quarter of 2025.
A more capital-intensive structure can still deliver attractive shareholder returns, in our view, but it can also introduce greater cyclicality to earnings, as asset-heavy businesses tend to be more sensitive to capacity utilization rates, pricing, and technological obsolescence (depreciation schedule and reinvestment needs). Another risk we are monitoring is whether outsized capex commitments could begin to crowd out share buybacks or push the AI ecosystem to increase reliance on debt.
Encouragingly, Big Tech’s return on invested capital (ROIC) remains elevated, and earnings momentum continues to outpace the broader market—factors that, we believe if sustained, can help preserve the group’s valuation premium despite higher capital intensity. This Big Tech group, which now makes up roughly a third of the S&P 500’s market cap, trades at an average forward P/E multiple of 26.1x, or about a 18 percent premium to the index, but below the average premium since 2015 (39 percent) and the five-year average (26 percent).
Return on invested capital remains elevated
Median return on invested capital (ROIC) of Big Tech companies*
Source - RBC Wealth Management, Bloomberg; quarterly data through 9/30/25. * Amazon, Alphabet, Microsoft, Meta Platforms, Oracle, Apple, Nvidia, Broadcom.
The chart shows the median return on invested capital (ROIC) of Big Tech companies (Alphabet, Amazon, Apple, Broadcom, Meta Platforms, Microsoft, Nvidia, and Oracle) since 2015. The ratio rose above 25% in 2022, then fell back to under 20%, before rebounding above 25% in 2024, where it remained as of the third quarter of 2025.
Big Tech’s valuation premium is below its long-term average
Average forward P/E multiple of Big Tech companies*
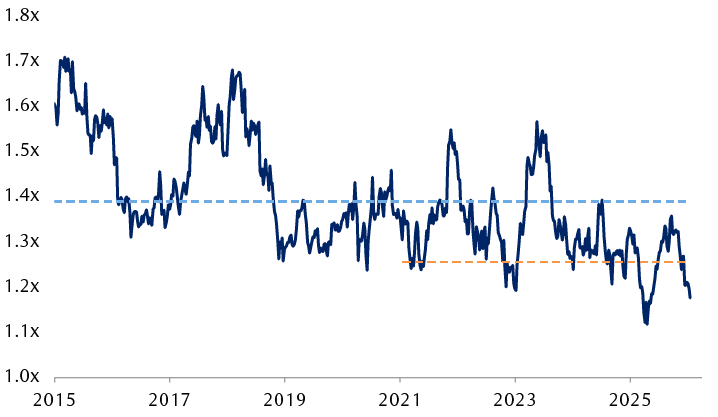
Source - RBC Wealth Management, Bloomberg; data through 1/16/26. * Amazon, Alphabet, Microsoft, Meta Platforms, Oracle, Apple, Nvidia, Broadcom.
The line chart shows the average forward price-to-earnings (P/E) multiple of Big Tech companies (Alphabet, Amazon, Apple, Broadcom, Meta Platforms, Microsoft, Nvidia, and Oracle) from 2015 through 2025, and highlights the 10-year average (roughly 1.4x) and the 5-year average (roughly 1.3x). As of January 2026, the P/E multiple had fallen to roughly 1.2x.
A balancing act
As outlined in our Global Insight 2026 Outlook, we believe AI will remain a central macro theme for years to come. The technology is still in the early phases of innovation and adoption, capital investment remains strong, and the potential to lift the long-term growth trajectory for the economy and corporate earnings is immense, in our view. Nevertheless, history reminds us that transformative general-purpose technologies—such as railroads and the internet—often require periods of overinvestment and lengthy diffusion-adoption cycles before delivering durable and widespread benefits.
For much of the past three years, the narrative has largely focused on the speed and scale of AI infrastructure buildout. As the cycle matures, we believe the narrative could evolve to a more discerning phase, with greater emphasis along two considerations:
- Monetization visibility and sustainability: The efficiency with which AI infrastructure investments translates into recurring revenues and generates sufficient returns on investment within a reasonable timeframe. This is likely, in our view, to sharpen the differentiation between tech companies that can fund AI spending through operating cash flow backed by durable business models with more concrete and measurable monetization pathways, and those more reliant on debt financing with less certain prospects for sustainable returns.
- AI “adopters” demonstrating real-world, tangible applications: Companies integrating AI in their businesses to accelerate automation, optimize cost structures, expand product and service capabilities, and boost productivity in ways that generate measurable value and help establish new or deepen existing competitive advantages. In this context, we believe AI represents a potentially disruptive force that could create a technological divide across industries, making it critical for companies to successfully harness the technology, particularly in sectors where AI has the capacity to reshape long-term earnings power.
With Big Tech having delivered exceptional returns for many years and driving elevated market concentration, ensuring portfolios are well balanced and adequately diversified across and beyond the group appears sensible to us.
We believe this discipline allows portfolios to maintain participation in AI-connected investment themes while helping to cushion against the risk of a “capex hangover,” manage performance correlation tied to a single risk factor, and navigate the prospect of market leadership rotations and more uneven performance among AI-linked companies.
Performance dispersion picked up in 2025
Excess returns relative to the S&P 500
| Company | 2022 | 2023 | 2024 | 2025 |
|---|---|---|---|---|
| Amazon | -31.50% | 54.60% | 19.40% | -12.70% |
| Alphabet | -21.00% | 32.10% | 11.00% | 48.10% |
| Microsoft | -9.90% | 31.90% | -12.10% | -2.30% |
| Meta Platforms | -46.10% | 167.90% | 41.00% | -4.80% |
| Oracle | 13.50% | 4.70% | 35.00% | 0.30% |
| Apple | -8.30% | 22.70% | 5.70% | -8.80% |
| Nvidia | -32.10% | 212.80% | 146.30% | 21.10% |
| Broadcom | 4.90% | 78.00% | 85.40% | 32.80% |
| Average relative performance | -16.30% | 75.60% | 41.50% | 9.20% |
Source - RBC Wealth Management, Bloomberg
It also positions portfolios, in our view, to capture a wider spectrum of opportunities, particularly if perceived AI beneficiaries expand beyond the Big Tech “hyperscalers” and “enablers” that have dominated the initial infrastructure buildout phase to include AI “adopters,” many of which are likely to reside in industries out of the tech sector.