Europe equities
Since the U.S./Israel-Iran conflict began, European equities, as measured by the STOXX 600 Europe ex UK index, have underperformed. Investors have focused on the region’s energy import dependency and fear of a repeat of the inflationary wave that followed the curtailment of Russia’s gas supplies in 2022. The index’s limited exposure to AI, a powerful driver of U.S. equity returns, has also held performance back.
There is no doubt that the Middle East conflict is a headwind for the region. Weakened consumer confidence may limit companies’ ability to pass on higher costs, potentially putting pressure on margins. Eurozone inflation rose to 3.2% y/y in May, which may entice the European Central Bank to lift interest rates a couple of times this year from the current 2% level.
Nevertheless, we believe the economic damage from the crisis may prove relatively limited. An RBC Global Asset Management analysis suggests that Europe uses significantly less oil and natural gas per unit of economic output than the U.S., reflecting its growing reliance on renewable energy and nuclear power.
Moreover, most national governments have also started to subsidize heightened energy costs, reducing economic pressures. This will create a future fiscal burden, but prior to the conflict, over half of eurozone member states were on track to meet the 3% of GDP budget deficit threshold in 2026, according to European Commission forecasts. Notably, this includes Italy and Greece, countries that had previously struggled with finances. Overall, consensus full-year 2026 GDP growth expectations have only been pared back to 0.8% from 1.2% earlier this year.
So long as the Middle East conflict continues, and the Strait of Hormuz remains disrupted, we think European equities are likely to trade sideways. Should the Strait reopen, or should meaningful progress emerge on a Russia/Ukraine settlement, European stocks would likely be a significant beneficiary.
We continue to see the European Industrials sector as offering attractive long-term investment opportunities supported by various structural tailwinds, while banks’ earnings momentum remains positive and valuations continue to be inexpensive in the context of the returns they are generating.
Overall, we think Asia fixed income should continue to offer steady income, but the easy gains from tighter spreads may be behind us.
Europe is relatively less reliant on fossil fuels than the U.S.
Oil and gas intensity of G7 countries’ GDP relative to the U.S. (2024)
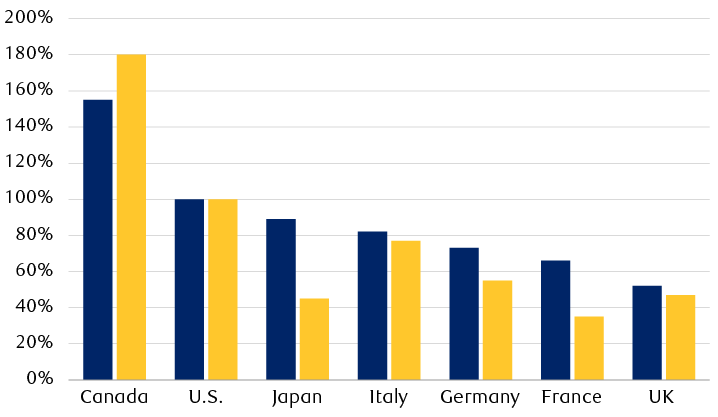
Energy intensity is measured as megajoules of energy derived from oil and natural gas consumption per U.S. dollar of GDP (constant 2015 dollars).
Source - RBC Global Asset Management, BP Statistical Review of World Energy, UN Conference on Trade and Development; data as of 5/24/26
The chart shows how much oil and natural gas each G7 country consumes per dollar of economic output, relative to the U.S. which serves as the benchmark at 100%. All European G7 members consumer significantly less than the US. The UK and France consume roughly 50% less oil and gas than the U.S. per dollar of GDP. At the other end of the spectrum, Canada is a higher-intensity user, consuming some 150% as much oil and 180% as much natural gas as the U.S. per dollar of GDP.
Europe fixed income
The uncertainties around the Middle East conflict and energy price shocks continue to inject a hawkish bias into the European Central Bank’s (ECB) policy outlook. RBC Capital Markets’ base case is a 0.3–0.4 percentage point drag on GDP growth this year, with a worst-case scenario of around 1.2 percentage points.
We outline two scenarios for H2 2026. First, if a resolution to the conflict occurs by the end of Q3 2026, inflation would remain elevated, before returning to the ECB’s 2% target within two years. Second, if the conflict extends beyond Q3, energy prices would likely remain elevated, inflation pressures would persist with second-round wage effects, and GDP growth would weaken further. We emphasise that the ECB’s June forecasts embedded three hikes into the estimates: inflation is forecast at 3.6% this year without significantly weaker economic growth of 0.8%. Therefore, embedding fewer hikes into its projections would have resulted in higher inflation and GDP growth. We conclude that the door is open for 50 bps of cumulative hikes in September and December, more than current market expectations of 40 bps.
Italian sovereign spreads—yield differentials relative to German Bunds—are unlikely to tighten in the near term despite recent fiscal improvements, in our view. French and Belgian spreads will likely remain wider, reflecting weaker fiscal positions, while Spanish and Portuguese spreads should stay relatively tight, underpinned by solid growth and improving public finances. Bond yields, especially longer-dated yields, may drift higher due to issuance increases this year and with the ECB continuing to reduce its balance sheet by not reinvesting matured bond proceeds. In the near term, we remain cautious on adding meaningful duration in sovereign bonds, but we think opportunities for long-term investors exist when yields reach year-to-date peak levels.
Corporate credit faces a challenging backdrop of higher inflation and weaker growth. While some issuer credit ratings have improved, we forecast spreads to widen—reflecting the additional compensation investors will demand for credit risk. At current levels, we remain Underweight corporate credit, particularly cyclical and consumer-facing issuers, where energy-driven pressures are squeezing margins and real household wages. We favour defensive sectors: Telecommunications, Utilities, and Health Care. We still see selective opportunities in Financials, Energy, and Materials.