Key points
- The market has performed well under various combinations of party control — including both controversial and plain vanilla presidencies.
- In terms of hot-button campaign issues, Wall Street’s priorities often differ from Main Street’s. And among the policy issues that catch Wall Street’s attention, very few end up being primary drivers of stock market or sector returns — especially long-term returns.
- The Fed, economy, innovation, and profits tend to matter more to stock market performance than politics and election outcomes. Developments at the White House and on Capitol Hill usually don’t make or break America’s $28 trillion economy or the profits of most S&P 500 companies.
- Stock market returns in past elections are useful to consider as there are some persistent and interesting patterns, but there are caveats.
Polls indicate that most Americans view the forthcoming U.S. presidential election on November 5 with great apprehension for a variety of reasons—and very different reasons depending on political party affiliation and ideology.
Over the years we’ve discovered that investors often apply their political anxieties to their views about prospects for the stock market and economy.
Republicans and populist conservatives tended to be rather concerned about the stock market’s outlook when Barack Obama and Joe Biden came to power, whereas Democrats and progressives were very nervous when Donald Trump was elected. Heading into this election, and given the stark divisions within the country, we sense that anxieties are even higher.
Yet the U.S. equity market rose meaningfully under the leadership of Obama and Trump and has risen thus far during the Biden administration.
We contend that the market’s strength during these and other periods — and its periods of weakness — had less to do with who or which party occupied the White House, or which party controlled the House of Representatives and Senate and had more to do with other factors.
As the election approaches and campaign rhetoric fans the flames even more, we think investors should keep in mind four guiding principles when it comes to financial markets.
#1 – The market has performed well under various combinations of party control
The U.S. stock market has risen during Republican and Democratic presidencies — including during both controversial and plain vanilla presidencies, as the chart below illustrates.
There were a couple lengthy periods when the S&P 500 struggled, such as during the 1970s when Presidents Richard Nixon and Gerald Ford (shown in red in the chart) and Jimmy Carter (in blue) served. But by and large, when we consider from 1933 onward, the market rose during a number of Republican and Democratic presidential periods, and substantially so at times.
Market gains have occurred under both parties
S&P 500 performance since 1933 by presidential party control (log scale)
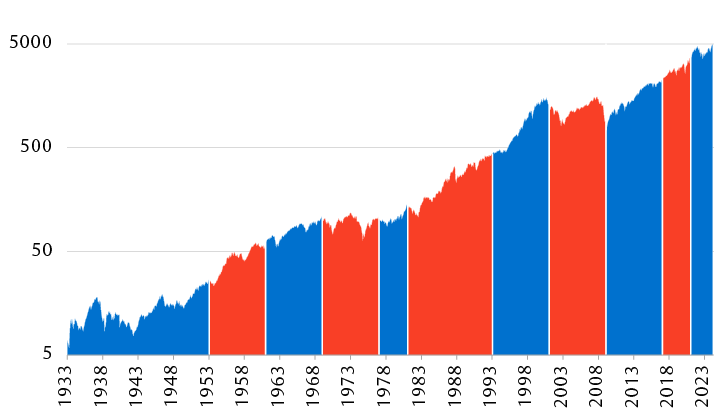
Area chart showing the S&P 500 since 1933 and is denotes when the Democratic Party and Republican Party held the presidency in 11 distinct periods of time. The market rose under democratic control, then it rose under Republican control, then rose under Democratic control, then traded roughly sideways under Republican control, then rose under Democratic control, then rose under Republican control, then rose under Democratic control, then fell somewhat during Republican control, then rose during Democratic control, then rose under Republican control, and more recently has risen somewhat during Democratic control.
Source - RBC Wealth Management, Bloomberg; monthly data through 2/20/24 shown on a logarithmic scale. Categories separated by inauguration dates when a party change occurred
Since 1953, S&P 500 returns have tended to be highest when the Democratic Party has controlled the presidency and Congressional control has been either divided between the two parties or firmly in Republican control. It also performed well when there was a Republican sweep.
Elephant or donkey—or both?
Average annual S&P 500 returns since 1953 by party control
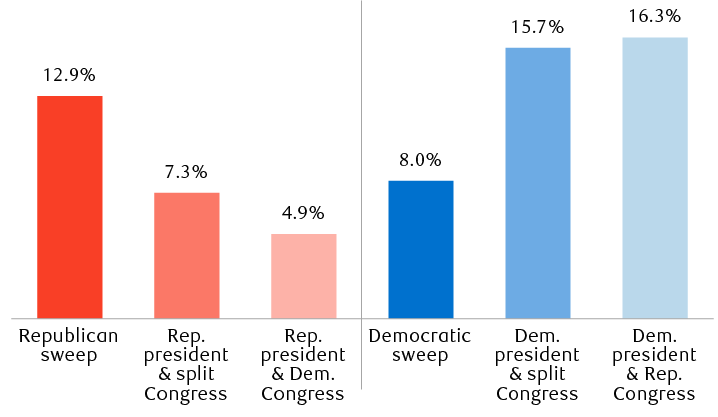
Column chart showing historical S&P 500 annual returns under various party control scenarios of the federal government. Returns are as follows. The S&P 500 rose 12.9%, on average, during periods of a Republican sweep (when the party controlled the presidency and both chambers of Congress). It rose 7.3% when the Republicans controlled the presidency and control of the Congress was split between Republicans and Democrats. It also rose 4.9% when Republicans controlled the presidency and the Democrats controlled both chambers of Congress. It rose 8.0% during periods of a Democratic sweep. It rose 15.7% when Democrats controlled the presidency and control of Congress was split between Republicans and Democrats. It rose 16.3% when Democrats controlled the presidency and Republicans controlled both chambers of Congress.
Source - RBC Wealth Management, Bloomberg; data through 12/31/23; data based on price returns (does not include dividends)
We think it’s most relevant to evaluate party control data from 1953 onward because at that time a major shift took place.
In the first half of the 20th Century, it was very common to have united, one-party control with either the Democratic or Republican Party holding all three levers of power: the presidency, Senate, and House. This happened in 85 percent of those years.
But beginning with the swearing in of Republican Dwight D. Eisenhower as president in 1953 through today, one-party control has been rarer, happening in only 37% of those years.
#2 – Wall Street’s priorities often differ from Main Street’s
There are a bevy of election issues that we think markets will be paying attention to during this campaign season and soon after the election related to economic policy, foreign policy, and sectors and industries.
Wall Street’s priorities, which are shown in the lists below, can differ from what large portions of the electorate prioritize. The market often ignores important social issues that help determine election outcomes. For example, this election season various voter groups are focused on crime, border security, homelessness, the fentanyl and opioid crises, abortion, etc. But, historically, social issues have had little direct, immediate, or discernable impact on corporate profit growth of large companies that make up the S&P 500, which is Wall Street’s primary focus.
A bevy of election issues for markets to focus on
| Economic policy | Foreign policy | Sectors & industries |
|---|---|---|
|
|
|
Source - RBC Wealth Management
This election cycle, we think three issues on the list above will stand out for Wall Street:
- Tax rates on individuals,
- tariff and trade policies, and
- the U.S.-China rivalry.
The presumptive Democratic and Republican nominees, Biden and Trump, seem to have very different ideas about taxation and tariff policies, and their detailed policy proposals will likely be clearer in the months ahead.
We think tax provisions will be front and center not only during the heat of the election campaign but even more so after the next president and Congress take office in 2025.
Many of the tax cuts for individuals that were passed in the Tax Cuts & Jobs Act (TCJA)—known as the “Trump tax cuts”—are scheduled to automatically sunset (expire) at end of 2025. If nothing is done to address some or all of the provisions, they would revert back to higher, pre-TCJA levels.
Tax issues likely to be front and center
Many of the Tax Cuts and Jobs Act (TCJA) provisions that benefited individual taxpayers starting in 2018 are scheduled to sunset at the end of 2025:
- The reduction of individual income tax rates and the restructuring of the tax brackets will expire
- The increase in the standard deduction, elimination of the personal exemption , and doubling of the child tax credit will expire
- Limits on the state and local tax deduction and the mortgage interest deduction will expire
- The decoupling of the income threshold for capital gains from ordinary income will expire
- The reduction of the alternative minimum tax will expire
- The reduction of the estate tax will expire
- The higher lifetime thresholds for gifts will expire
Source - Tax Foundation, Kiplinger, RBC Wealth Management. Items impacted by TCJA sunset provisions are not limited to this information. This information does not construe tax advice.
There are no sunset provisions for the corporate tax rate reductions that were included in the TCJA, but corporate rates could change if the next president and Congress agree on tax hikes or cuts.
We think foreign policy issues are more important to Wall Street this election than in recent ones. This is not only due to the high-profile military conflicts in Eastern Europe and the Middle East, but also because tariff and economic sanctions policies have played greater roles in the current and previous two presidential administrations. This will likely continue regardless of who is elected president in 2024. From our vantage point, sanctions and trade restrictions, rather than good old-fashioned diplomacy, have become fixations of the U.S. foreign policy establishment—even though they quite often don’t work.
We intend to evaluate the two leading candidates’ tariff, trade, sanctions, and tax proposals in the future as the policies become more specific and formalized.
Aside from trade issues, among the long list of issues above that will likely attract the attention of equity market strategists and economists, most are unlikely to be key drivers of stock market or sector returns, in our view—especially long-term returns. Policymaking in Washington involves many different checks and balances including corporate lobbying, and we think other factors have primarily driven profits and stock market performance.
#3 – The Fed, economy, innovation, and profits tend to matter more than Washington policies
Developments at the White House and on Capitol Hill usually don’t make or break America’s $28 trillion economy or the profits of most S&P 500 companies, in our assessment.
Rather, the Fed’s monetary policies have historically influenced the economy, inflation, bank lending, and credit availability much more. The Fed’s decisions tend to help shape the business cycle, which in turn highly influences corporate profit growth—the latter of which is the mother’s milk of the stock market.
Likewise, Fed policies also have tended to be major determining factors of U.S. bond market performance and have increasingly influenced policies of other developed-market central banks and performance of those bond markets.
The natural movement of U.S. economic activity—from the start of a new growth cycle, to midcycle, to recession, and back again—has also historically been a major determinant of U.S. financial market returns.
And innovation has been a key factor. Think back to the previous major leaps in technology—from the advent of personal computers, to wide usage of the internet, and more recently to artificial intelligence—and it becomes apparent that innovation often drives profit growth and stock prices.
This is not just applicable to technology-related stocks. Many sectors and industries ranging from health care, to industrials, energy, utilities, transportation, shipping, financial services, and more, have benefitted greatly from innovation—and we think their stock prices have too.
Washington policy decisions have at times spurred on and incentivized innovation, but more often than not it occurred naturally within the competitive U.S. and global free enterprise system.
#4 – Historical election data are useful to consider, but there are caveats
An interesting pattern has developed over many years. When we divide time into four periods—the election year, then year one of the presidential term, then year two of the presidential term (which is also the midterm election year), and then year three—we see a persistent pattern of performance stretching back to 1928.
The S&P 500 was strongest in year three, and second-strongest during the presidential election year.
Political pundits and market strategists have their theories as to why this four-year pattern has persisted—some of which involve higher federal spending in year three, and there is some data that points to Fed policy patterns in the various years. But we have yet to find reliable, concrete explanations.
Four-year presidential cycle track record
S&P 500 performance during U.S. presidential election cycles since 1928
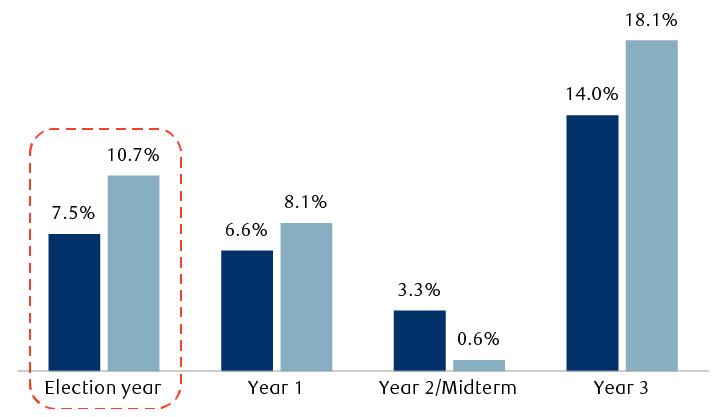
Bar chart showing S&P 500 price returns on an average and median basis divided up into the four-year presidential cycle since 1928. In the election year, the S&P 500 rose 7.5% on average and 10.7% on a median basis. In year 1 of the presidential term, it rose 6.6% on average and 8.1% median. In year 2, which is also the midterm election, it rose 3.3% on average and 0.6% median. In year 3, it rose 14.0% on average and 18.1% median.
Note: “Year 1” is the first year of the presidential term, “Year 2” is the second year and so forth.
Source - RBC Wealth Management, Bloomberg; annual data through 2023; data based on price returns (does not include dividends)
The market has also tended to follow a similar pattern during the presidential election year. The gains tend to come during the summer and later in the year.
For example, when we combine all of the presidential election years since 1928 and average them together, the chart below shows that the market treaded water during the primary season, but then rose in the summer, and posted nice gains after the November election.
Gains typically came later in the year
Average path of S&P 500 during presidential election years since 1928
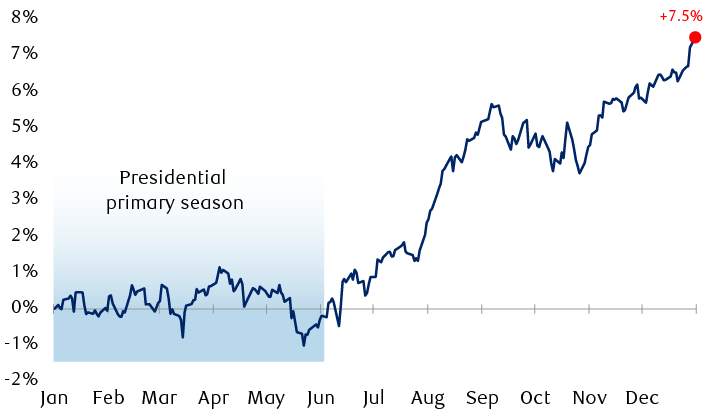
Line chart showing the average path of the S&P 500 throughout a full year (from January through December) for all of the presidential election years since 1928. On average, the market treaded water (went sideways) during the primary season from January through May, but then rose meaningfully in the summer, then pulled back slightly up until the election, and then posted nice gains after the November election. On average, the S&P 500 rose 7.5% during election years.
Source - RBC Wealth Management, Bloomberg; data through 2020 election; data based on price returns (does not include dividends)
But what about the controversial election years in recent years and decades?
When Hillary Clinton and Donald Trump faced off in 2016 and Trump and Biden competed in 2020, the market corrected during the spring (for reasons unrelated to the election) and rallied toward year end, closing near the highs of the year. The S&P 500 finished 2016 and 2020 up 9.5 percent and 16.3 percent, respectively. Controversies and all, in each case the market beat the 7.5 percent long-term average gain during election years.
However, not all controversial presidential election years ended in rallies.
When George W. Bush and Al Gore faced off in 2000, the S&P 500 was particularly weak during the “hanging chads” Florida recount and pivotal court proceedings which lasted for over one month. The market didn’t like the uncertainty associated with the recount and unprecedented legal issues.
The S&P 500 fell nearly 12 percent from the close on Election Day to the December low, and it dropped 10.1 percent for the full year—well below the average 7.5 percent election year gain.
Performance that year was also greatly impacted by the bursting of the Tech bubble, which began in March 2000 and stretched all the way into 2002. Florida recount uncertainty was a factor, but not the sole driver of poor equity returns in 2000 or during that longer period, as the chart shows.
Bigger issues than the Bush vs. Gore recount
S&P 500 from 2000–2002 mainly impacted by the bursting of the Tech bubble
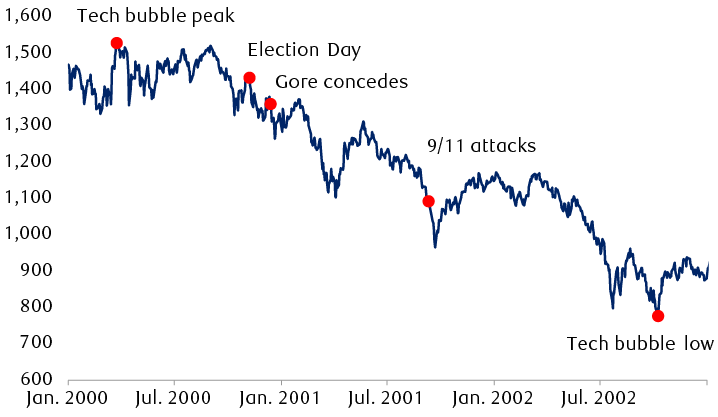
Line chart showing the S&P 500 from January 2000 through December 2002. The market peaked in March 2000; this period was called the peak of the Tech bubble. The market traded mostly sideways after that but started to weaken in September 2000. The market sold off after the November 2000 election when the Florida vote recount and court decisions took place. In early 2001 the market started to rebound, but then fell again until April 2001. It bounced after that but started to selloff again. After the 9/11 attacks, it sold off further. It rebounded somewhat in late 2001 only to slump again. It reached a low point in October 2002; this was the Tech-bubble low. It bounced slightly after that to close out 2002 but remained at a low level relative to the Tech bubble peak in 2000.
Source - RBC Wealth Management, Bloomberg; data from 1/1/00–12/31/02
This is yet another illustration which underscores our view that it’s important to remember other factors tend to influence the stock market much more than election outcomes.
Furthermore, one should also keep in mind there are caveats to historical market-related election data. Even when we track S&P 500 data and trends going back to 1928, there are not a lot of datapoints, especially when they are sliced and diced into various categories. One big rally year or one big selloff year can change the averages notably, and there tend to be wide variations around the averages.
Focus on the bigger picture
Americans and observers outside the country who are interested in politics and public policy rightly assign high importance to U.S. election outcomes. But we think U.S. financial markets are typically more influenced by Fed policies in the short run and by economic trends, innovation, and profit growth over a longer time frame.
As the campaign season progresses, stay tuned for more of RBC’s election-related insights which will dig into policy issues that are most relevant for the economy, markets, sectors, and industries.