Big tariffs are indeed a big challenge, both for economies and stock market investors.
As of this writing, the S&P 500 Index is roughly flat during intraday trading on Monday, April 7, and has fallen 13.6 percent year to date and 17.2 percent from its all-time high in February. The Dow Jones Industrial Average and other major indexes also have been hit hard during this period, not to mention the decline in equity markets outside of the U.S.
During such periods of extreme volatility and steep drops in stock prices, there is a reasonable temptation to make drastic asset class or sector changes to investment portfolios. We think it’s best to avoid this.
The U.S. stock market and other major markets have ultimately overcome many challenges in the past—including extreme challenges—and we believe they will this time too.
From our vantage point, some of the best companies in the world are headquartered in the United States. We believe they will be able to adapt to Washington’s policy decisions.
Importantly, we believe Washington’s policy decisions will adjust to the realities on the ground, so to speak. In other words, we think Washington will be forced to contend with the realities of the market selloff, the associated economic risks, and public opinion—the latter of which should not be underestimated. The U.S. investor base is broad, and investors vote.
We explain more about our thinking in the context of questions that we’ve been fielding from financial advisors and clients.
Is this correction different?
This correction is absolutely different, in our opinion, especially considering the global paradigm shift we discuss below. Also, the plunge has been sharper and quicker than the average historical correction.
While it began with weaker Q1 economic data partly due to looming tariff fears, its force accelerated after the U.S. officially hiked tariffs on April 2 to a level not seen in more than 100 years, exacerbating stagflation and recession risks for the U.S. economy and generating significant uncertainties about medium- and long-term trade relations.
But we think it’s important for investors to keep in mind that stock market corrections are inherently almost always “different” from those in the past.
Each correction has its own unique catalysts—whether the correction is moderate, large, or something in between, and whether it is sharp or something that unfolds at a slower pace.
One has to only recall the unique causes of the most notable corrections of the past 25 years: The global pandemic in 2020, the global financial crisis and U.S. housing crisis in 2008–2009, and the bursting of the U.S. technology bubble in 2000–2001. The catalysts were rather dissimilar.
And there have been many other corrections in between and before these episodes, each with their own particular contours.
The nature of stock market corrections reminds us of the old expression, “It’s never happened before and here it is again.”
- Since 1928, the S&P 500 has experienced 103 corrections of 10 percent or more and 27 corrections of 20 percent or more.
- In the modern era since 1980, the average maximum peak-to-trough decline in the S&P 500 each year was 13.9 percent, as the chart below shows. In other words, corrections have been commonplace.
- During this modern era period, the S&P 500 declined by 15 percent or more peak to trough during 16 of the 45 years through 2024. In nine of those years it declined by 20 percent or more peak to trough.
- Nevertheless, since 1980, the S&P 500 traded higher for the year in 35 of the 45 years.
- Since 1980, the market fell in consecutive years on only one occasion, in 2000, 2001, and 2002, a period when the technology bubble burst, the 9/11 attacks occurred, the U.S. began its military intervention in Afghanistan, and a mild recession arose.
Pullbacks and corrections are normal
S&P 500 performance and maximum drawdowns by year
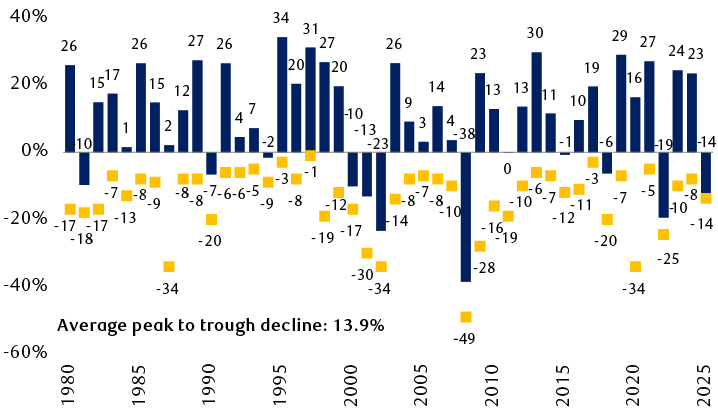
The column chart shows S&P 500 full-year returns from 1980 to 2024 and the year-to-date return for 2025 through April 4. Through 2024, there are 35 positive years of the 45 total years. The worst period was the three years of consecutive declines in 2000, 2001, and 2002. There were no other sequential decline years. The chart also shows the maximum drawdown periods in each year. The S&P 500 declined by 15 percent or more peak to trough during 16 of the 45 years through 2024. In nine of those years it declined by 20 percent or more peak to trough.
Source - RBC Wealth Management, Bloomberg; data through 4/4/25
Is this a global paradigm shift?
Following the significant tariffs announced in the White House Rose Garden on April 2, RBC Economics estimates that the effective U.S. tariff rate surged from 2.4 percent in 2024 all the way up to 24 percent.
If this elevated level stays in place, this would be the highest effective tariff rate since 1906, according to The Budget Lab at Yale University.
If this isn’t a paradigm shift, then what is?
Even if the effective tariff rate retreats following any forthcoming negotiated trade deals—a likelihood, in our view—we think the genie is out of the bottle. President Donald Trump’s trade policies further change the nature of geo-economic and geopolitical relations. In fact, we believe the seeds of deglobalization and trade fragmentation along the shift toward a multipolar world were sown years ago, which we outlined in this report in May 2023. But Trump has stepped down hard on the gas pedal and has accelerated the process, wittingly or unwittingly.
Paradigm shift: Highest tariff level since 1906
U.S. average effective tariff rate since 1790 and current estimate
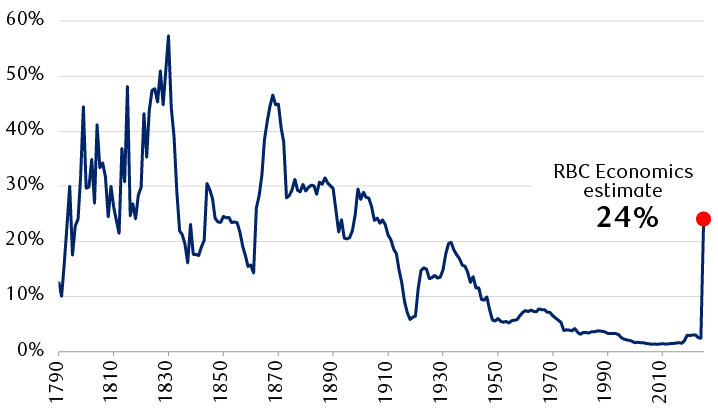
The line chart shows the U.S. average effective tariff rate from 1790 to 2024 and RBC Economics’ estimate of the effective tariff rate in 2025 following the tariff announcements on April 2, 2025. The average effective rate was very high during the early years of the country, peaking at 57% in 1830. It then fell significantly, reaching 14% in 1861, before spiking to almost 47% in 1869. The tariff rate followed a downward path from that point through 2024, although it reached almost 20% in 1933. It fell to very low levels and was at 2.4% in 2024. However, given the recent tariff announcements, RBC Economics estimates the average effective tariff rate has jumped up to 24%.
24% is the estimated effective tariff rate following the reciprocal tariff announcements on 4/2/25. RBC estimate subject to change if tariff levels change.
Source - The Budget Lab at Yale University (historical data through 2024), RBC Economics estimate as of 4/3/25
Paradigm shift or not, we think there is wiggle room for near-term U.S. tariff policy.
Kevin Hassett, director of the White House National Economic Council, said that more than 50 countries have already reached out to negotiate tariff levels. Reports from Bloomberg indicate this includes Japan, Indonesia, and Vietnam. Taiwan is attempting to strike a deal as well. At some point, we believe negotiations between the U.S. and EU will commence.
Also, domestic U.S. political risks can’t be ignored, in our view.
We’d be surprised if Trump didn’t adjust his tariff policies in the coming weeks or months, including by at least telegraphing some progress on tentative trade deals—especially if political pressure builds and inflation and overall economic data continue to deteriorate.
RBC Economics Senior U.S. Economist Mike Reid estimates that tariffs near the existing effective rate of 24 percent could cause the Core Consumer Price Index (consumer inflation excluding food and energy) to jump from 3.1 percent in February to roughly 3.8 percent by July, before easing to about 2.7 percent by late 2026.
This would come on top of an overall rise in consumer prices of roughly 24 percent since right before the pandemic, according to official statistics. Anecdotal evidence suggests prices for a lot of goods and services have risen more.
Another inflation wave could potentially impact the November 2026 midterm congressional elections, as conservative Republican Senator Ted Cruz strongly warned over the weekend. Polls indicate inflation continues to be among American voters’ top concerns.
Clearly the profit outlook is murky. How should investors be thinking about this?
One of the biggest unknowns for equity markets is how tariffs will impact corporate profits in the near and medium term. This is important because profit growth is the mother’s milk of stock markets.
What we have now is an abundance of uncertainty about profits. Regional Federal Reserve surveys indicate that many companies of all sizes are having difficulty gauging the impact of tariffs on supply chains and future demand, and they are having a hard time making capital spending decisions given the economic uncertainties.
The Q1 earnings reporting season, which begins in earnest this week, might add a little clarity, but we think earnings uncertainty will linger for months due to tariff and related supply chain risks.
RBC Capital Markets Head of U.S. Equity Strategy Lori Calvasina has lowered her 2025 S&P 500 earnings per share forecast twice in the past three weeks.
Calvasina’s forecast stood at $271 per share at the beginning of the year, and came down to $264 per share on March 17 as Q1 economic data wobbled and tariff risks started to rise, and was reduced again to $258 per share on April 4, soon after the Rose Garden tariff announcements.
If the $258 per share forecast pans out, this would represent S&P 500 profit growth of about 4.5 percent from the 2024 level—below average although not bad given the circumstances.
But if a recession were to materialize, there’s little doubt in our minds that there would be downside risk to Calvasina’s $258 per share forecast.
When recessions occur, profits usually decline rather than increase. And equity market corrections during recessions tend to be deeper and the path back to the previous high tends to take longer to traverse.
Thus far, RBC’s economists are not forecasting a recession, but they acknowledge the risks have risen. And while our proprietary recession indicators have been warning of elevated recession risks for a while, not all of them are flashing red right now.
In tandem with the latest earnings revision, Calvasina has also lowered her 2025 year-end S&P 500 price target to 5,550 and noted that the situation had morphed from a “garden variety” correction to a “growth scare,” which is typically more forceful. Growth scares occur when recession fears rise and begin to be priced into the market—but a recession doesn’t actually pan out when all is said and done.
Although the 5,550 year-end S&P 500 price target is higher than the market’s 5,074 level as of the April 4 close and where the market is trading as of this writing, it would represent a slight decline for the year.
Both Calvasina’s price target and earnings forecast assume U.S. real GDP growth in the 0.1 percent to 1.0 percent range for 2025—a level we often refer to as “stall speed.” Such tepid growth, coupled with RBC Economics’ forecast of higher inflation due to tariffs, would represent a mild stagflationary economic environment.
Are there areas of the U.S. equity market that can at least hold up better against the headwinds?
It’s currently difficult to gauge the sector and industry implications of tariffs because of the interplay between tariffs and the economy, and domestic recession risks.
Let’s take the Financials sector, for example. These are services companies and thus far the tariffs are on goods, not services. But if tariffs cause a U.S. recession or unforeseen risks arise within the global financial system, Financials stocks would likely be negatively impacted. However, if the U.S. and global economies can sidestep a recession, then we think there ultimately could be a buying opportunity in Financials.
Similar assessments can be made for industries and companies that are mainly domestically oriented and not highly dependent on foreign supply chains. The state of the U.S. economy will largely determine the fate of their corporate profits in coming quarters.
One S&P 500 sector that we continue to favor, however, is Utilities. This defensive sector tends to hold up better when economic risks rise, and revenue and profits of the underlying Utilities companies tend to be rather predictable, even when economic conditions are challenging. Utilities within the S&P 500 are mainly domestic firms, and they don’t produce goods, so they aren’t directly impacted by tariffs. The sector has a dividend yield higher than the S&P 500.
More broadly, we continue to recommend tilting equity exposure toward “high-quality” stocks, particularly dividend growers.
“High-quality” stocks represent companies that have strong balance sheets, good cash flows, and financial flexibility, so that if they need to cut expenses, they can. These are companies with competent management teams who have experience at the helm during different phases of the economic cycle—both in good times and uncertain or challenging times.
Within this category, we favor dividend growth stocks—companies that have the financial wherewithal to raise their dividends year in and year out, regardless of the state of the economy.
Tilt toward high quality, and dividend growers in particular
Annual total returns since 2000
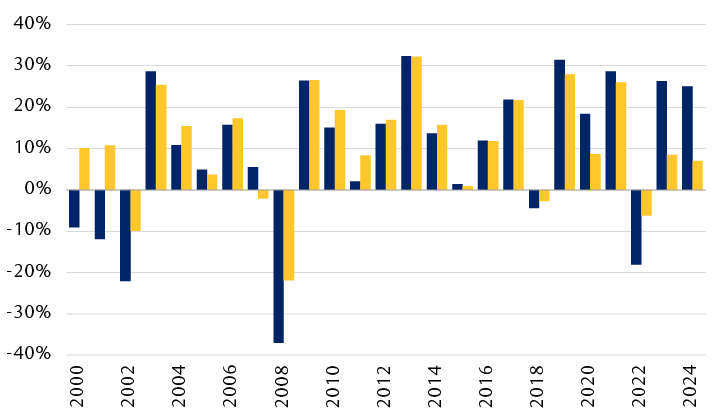
The chart shows annual total returns for the S&P 500 and S&P Dividend Aristocrats Index (which consists of dividend growth stocks). Dividend Aristocrats outperformed the S&P 500 in down years and in some years of moderate returns. While the S&P 500 outperformed in a number of the positive years, the outperformance was typically small, except for 2023 and 2024.
Source - RBC Wealth Management, Bloomberg; annual total return data through 2024 (includes dividends)
Historically, in many of the good years, dividend growth stocks performed similarly to the S&P 500, but they tended to be less volatile and less risky.
However, an anomaly occurred in the past two years. Dividend growth stocks lagged the S&P 500 meaningfully in 2023 and 2024. This happened because the so-called Magnificent 7 artificial intelligence stocks (Alphabet, Amazon, Apple, Meta Platforms, Microsoft, NVIDIA, and Tesla) performed very well and represented much of the S&P 500 gains in those two years.
We think dividend growth stocks have the potential to outperform the S&P 500 this year.
Also notice the chart shows that in not-so-great years and in bad years, dividend growth stocks performed better than the S&P 500. In other words, historically, they have provided at least some downside cushion.
Regarding this market shock, our advice to long-term investors is to take some deep breaths and count to 100, so to speak, before making big asset allocation and sector decisions.
Stock market corrections—especially those tied to extreme circumstances—are admittedly difficult to endure. But we are investing in companies, not Washington policies, and historically companies have proven to be far more adaptable and resilient than is often given credit.