In 1977, the U.S. Congress updated the Federal Reserve Act to lay out three clear goals for the U.S. central bank: “maximum employment, stable prices, and moderate long-term interest rates.” The third of these goals has effectively been subsumed into the other two, with economists deciding that stable prices and maximum employment will inevitably result in moderate long-term interest rates. The result is the Fed’s so-called dual mandate to keep unemployment as low as possible while keeping consumer inflation at or near two percent.
While the dual mandate is a legal reality for the central bank, we believe it’s a mistake to think the Fed pursues both objectives simultaneously. Instead, we see the policies as sequential, with price stability a prerequisite for providing labor market support. In our view, the central bank’s upcoming July meeting is likely to be the last where price stability considerations dominate, with labor market concerns transitioning to the forefront of Fed policymaking in September. The result is that employment data—already important to investors—could play an even greater role in driving bond markets in the months ahead.
Inflation under control
We believe that the June Consumer Price Index shifted the burden of proof in the inflation debate. The trend leading into June was positive for the price stability argument, but the latest data—which we discussed in a recent report—make it unreasonable, in our view, to maintain that higher-for-longer interest rates are needed to achieve price stability in an economically relevant time horizon.
This does not mean that there are no risks to the inflation forecast. We would expect continued volatility in monthly price data, for instance. More importantly, the U.S. economy remains vulnerable to policy and geopolitical shocks. But barring significant external events, we expect investors to largely look through any single month of disappointing price data, given the solid backing to the narrative of falling inflation.
Labor market wild card and mixed messages
The relative comfort on inflation should give the Fed room to shift to the second half of its dual mandate, the goal of full employment.
Here, the picture is mixed. Payrolls continue to grow at a solid clip, with over 200,000 jobs created in June 2024 alone. That level of growth really doesn’t provide much sense of urgency for rate cuts and argues for a wait-and-see approach, in our view. But at the same time, the unemployment rate shifted higher, topping four percent for the first time since late 2021. We think unemployment levels give a much stronger argument in favor of pushing rate cuts into the discussion, even if part of the rise is attributable to a growing labor force.
How many jobs in the U.S.? Depends who you ask
Households report nearly four million fewer jobs than payroll count

The chart compares the total employment in the U.S. as calculated by the Bureau of Labor Statistics Household Survey and the employer nonfarm payroll count, from June 2004 through June 2024. The household survey shows nearly four million fewer jobs currently than reported by employers.
Source - RBC Wealth Management, U.S. Bureau of Labor Statistics, Bloomberg
There are a few reasons why the two indicators can point in different directions.
One is their source. Payroll numbers come from employers, while unemployment data—which by definition includes people who currently lack an employer—comes from a survey of households. This leads to workers with multiple jobs contributing to higher totals in the employer count than in the household count, for instance.
Another difference is the definition of employment—the household survey has a much broader concept of working that includes the self-employed, workers on leave, and household employees. The net result is that the household survey usually reflects a higher overall level of employment than the employer survey.
The Bureau of Labor Statistics (BLS) has a robust statistical approach to account for these differences. Since the mid-1990s, the federal agency has published an adjusted household survey that has closely tracked the employer-derived payroll counts. Unfortunately, that close relationship has broken down over the past two years. Adjusted household data from June shows nearly four million fewer jobs in the U.S. than reflected in the employer data.
The trend in household data is also decidedly more negative. Total adjusted household employment shows a loss of nearly 230,000 jobs in the U.S. economy since August 2023. In that same period, employers reported a net 2.2 million increase in payrolls. Discrepancies between the adjusted numbers and the employer counts have occurred in the past, but not at this magnitude.
We have two reasons to give credence to the adjusted household survey. First, while it may seem like a simple process to just add up payroll data, one complication is that businesses are continually opening and closing. The BLS adjusts for this dynamic, but that adjustment may be insufficient. The early phase of the pandemic saw significant business creation, and it would not be surprising to think that business closures are now above trend. Another potential issue is the rise of so-called gig workers. The BLS adjustments are based on historical data that may not fully reflect the prevalence of this type of household income generation.
Obsessing over survey methodologies can distract from the real goal, which is gauging the strength of the labor market. Employment levels are a key input in that analysis, but we also have other measures like economic activity, wage data, and levels of household debt delinquencies. By the Fed’s estimate, after looking at the broad economic context, unemployment is still slightly below the theoretical level for “full employment,” but central banks need to account for policy lags as it takes time for rate changes to filter through the economy.
On balance, and even accounting for pockets of economic strength, we think it is more reasonable than not to conclude the labor market is likely softer than reflected in headline payroll growth.
Investors see deeper Fed cuts after July data
Interest rate futures reflect an additional 25 basis point move by January 2025
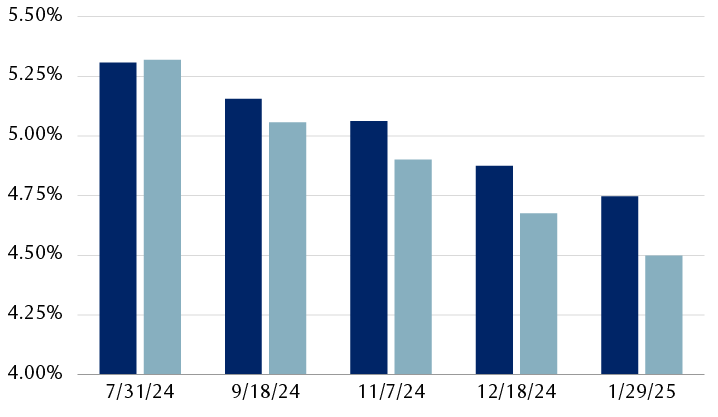
The column chart compares the overnight U.S. interest rates at several points in the next six months as implied by interest rate futures prices on July 1 and July 23, 2024. The estimates (July 1 vs July 23) are: July 31, 5.31% vs 5.32%; September 18, 5.16% vs 5.06%; November 7, 5.06% vs 4.90%; December 18, 4.88% vs 4.68%; January 29, 2025, 4.75% vs 4.50%.
Source - RBC Wealth Management, Bloomberg
See you in September?
We think the trend in inflation data and the Fed’s dual mandate give the central bank the latitude to consider cuts as early as next week’s meeting. But it’s the second leg of the central bank’s job—the goal of keeping folks working—that will provide the driver to lower rates, and we think that’s a September call.