September is usually a busy month for corporate bond sales, and this year is off to a historic start, with a record-setting 29 companies selling bonds on the first business day of the month. A survey of banks conducted by Bloomberg indicated a likely slower pace ahead, with expectations that higher-rated, or “investment-grade,” companies will sell $125 billion of bonds by month-end, similar to last year’s volume.
Lower-rated issuers, often referred to as high-yield, have also been active, with $357 billion in 2024 bond sales through August 31, nearly double the pace of 2022 sales and well ahead of last year’s numbers. In addition to bond sales, high-yield borrowers have been tapping loan markets for record amounts. One reason for the increased borrowings is to gain additional time for repayment—high-yield borrowers this year have refinanced nearly $170 billion of upcoming maturities, the largest reduction on record.
Demand meets supply
Markets have had little difficulty absorbing the large volume of issuance. Credit spreads—which measure the additional yield investors receive for taking on higher perceived default risk—ended August down almost 30 basis points year to date and are hovering near their lowest levels in almost two years. Credit spreads are inversely related to price, meaning corporate bond indexes have outperformed Treasuries so far this year.
It may seem counter-intuitive that such a large volume of bond selling would not lead to pricing pressure, but we see several reasons for the apparent discrepancy.
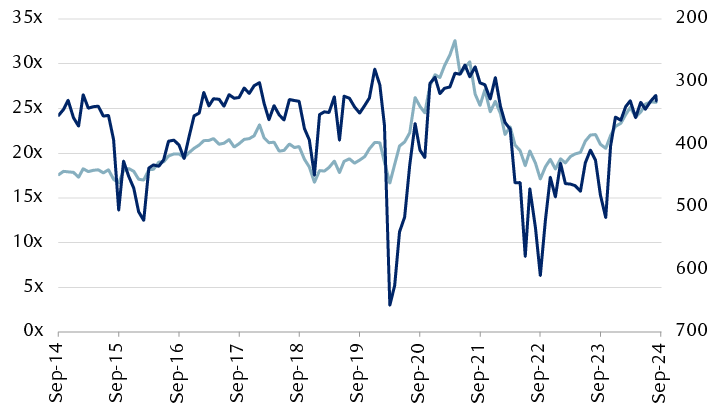
First, while compensation for corporate bond risk looks paltry relative to historical credit spreads, the picture is less clear when we compare bonds to other types of investments. Compared to S&P 500 valuations, for instance, we believe it’s difficult to argue that corporate bonds look particularly expensive. Spreads today are at essentially the same level as they were in prior periods when stocks were trading at these types of price-to-earnings multiples. For investors who are looking for income but are uncomfortable with the current levels of stock prices, we believe corporate bonds are an alternative worth exploring.
Credit may be rich, but not uniquely so
Equity multiples look consistent with tight spread levels

The line chart compares the price-to-earnings (P/E) multiple for the S&P 500 with the High-Yield CDX Index, an agglomeration of credit derivatives linked to 100 large, sub-investment grade issuers. The chart shows that the CDX Index (inverted) closely tracks the S&P 500 P/E.
Note: bps = basis points.
Source - RBC Wealth Management, Bloomberg
Another reason for investor demand at these price levels, we believe, is a degree of comfort—or potentially complacency—around likely default levels in the near term. One of the key points of default is that it tends to happen mainly when large amounts of money are due. The fact that lower-rated, high-yield borrowers have extended their debt maturities by paying down significant amounts of near-term debt reduces—but certainly does not eliminate—the possibility of large-scale near-term defaults.
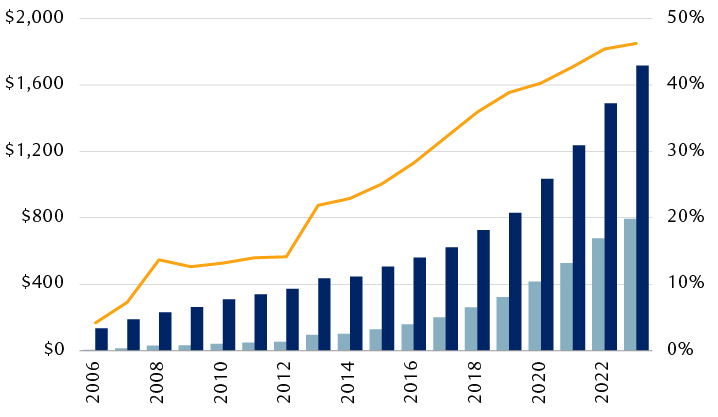
A final reason for the high level of current demand, we believe, is the rapid growth of private credit funds, and the need for these managers to put money to work. Although private credit tends to make direct loans to companies instead of buying bonds, their activity influences pricing across the capital structure. The chart at right understates the magnitude of the sector since data on assets under management (AUM) is only available with a significant lag.
Private credit is a rising force in direct lending
Fund activities likely add downward pressure on spreads

The chart shows the growth in assets under management (AUM) in direct lending private credit strategies and the total invested in private credit funds, and direct lending’s share of private credit activity, from 2006 through June 2023. Private credit strategies AUM grew more than tenfold, with direct lending rising from 4% to 46% of AUM in that time.
Note: AUM = Assets Under Management.
Source - RBC Wealth Management, U.S. Federal Reserve; data through 6/30/23
Risk transfer in a world of uncertainty
We can think of many reasons why higher-rated, investment-grade corporations are looking to issue now, but we believe it mostly boils down to managing uncertainty. Companies are dealing with both economic unknowns, as recession risks remain despite the Fed’s best efforts to engineer a so-called “soft landing,” and policy variability, with a wide range of potential outcomes turning on November’s election results. When there is a large range of potential outcomes, we think it makes sense for companies to lock in funding at good—even if not the greatest—rates. This is particularly true for high-grade borrowers who can sell 10-year bonds with yields below money market rates, creating potential cash flow gains from just depositing bond sale proceeds.
For investors, corporate bonds provide risk mitigation of a different sort. The Fed has telegraphed the start of a rate-cutting cycle beginning this month. The exact number and magnitude of the cuts is currently unknown and will depend on a host of variables, including labor market performance and fiscal policy changes. What does seem clear, however, is that the outsized returns from holding cash are likely to diminish soon and that investors will need to find alternatives to replace that cash flow. Corporate bonds have traditionally been a key source of portfolio income generation, and it’s not surprising to us that some investors are looking to add holdings as they redeploy cash.
The road ahead
The attractiveness of corporate bonds as a sub-asset class at these levels largely depends, we believe, on an investor’s time horizon. For investors with a multi-year outlook and focused on maximizing cash flows, investment-grade bonds can provide a potentially interesting yield advantage over U.S. Treasuries. On a shorter time horizon, however, it may prove difficult for corporate bonds to significantly outperform their government counterparts. The combination of a potentially slowing economy and heightened policy uncertainty may make it difficult for corporate bonds to continue their recent track record of gains.

