The Fed finally joined a handful of global central banks in dialing back interest rates in response to the significant progress made on the global inflationary wave which peaked way back in 2022.
But to achieve that, the Fed had raised interest rates to the highest levels in the U.S. since 2007 by the middle of 2023, and left them there for one of the longest stretches on record, perhaps raising the prospect of an economic slowdown as a result. But the early read based on the market response is that the Fed’s proactive, and supersized, 50 basis point (bps) cut in September—along with indications that more is to be done—should shore up the economic outlook even as concerns linger.
To wit, RBC Global Asset Management Inc. Chief Economist Eric Lascelles also views the Fed’s proactive move favorably, downgrading the chances of a recession within the next 12 months to 30 percent, from 40 percent previously. Supporting that view he notes that:
- The Fed cut its policy rate by 50 bps. This simultaneously supports the economy and signals that the Fed could continue to move quickly if the economy were to stumble.
- Economic data has improved over the past six weeks, with the ISM Services Purchasing Managers’ Index rebounding back above 50 (indicating expansionary activity), the unemployment rate edging lower, jobless claims falling steadily, retail sales reporting an unexpectedly chipper outcome, and Q3 GDP growth tracking a strong 3.1 percent annualized, according to the Atlanta Fed’s GDPNow model.
- Little stress appears visible in credit markets. Credit spreads are narrow, mortgage rates are falling, and bank lending standards are easing.
- Lower oil prices provide further support for economic growth, and also reduce the risk of inflation reigniting.
That said, downside risks for the U.S. economy—and particularly for the labor market—have not completely dissipated, and we do expect further supersized rate cuts from the Fed over the near term.
More now, less later
With a 50 bps rate cut out of the gate, we think the Fed may have learned the lessons of the 2022 rate hike cycle. In March 2022, policymakers kicked things off with a standard hike of 25 bps, but immediately had to shift gears with a run of jumbo hikes of 50 bps, 75 bps, 75 bps, 75 bps, 75 bps, and 50 bps to play catch up to inflation before a series of 25 bps hikes closed out the policy tightening cycle in July 2023.
So that risk of getting off to a slow start, and potentially falling behind a cooling economy, perhaps factored into the Fed’s thinking, and is why we believe there will be at least a handful of more large cuts. Markets are pricing a swift return toward more neutral levels—that is to say, levels that are neither restrictive nor stimulative for economic growth and inflation—which the Fed now judges to be somewhere around three percent, still a historically elevated level.
Markets are pricing a swift return to “neutral” interest rates
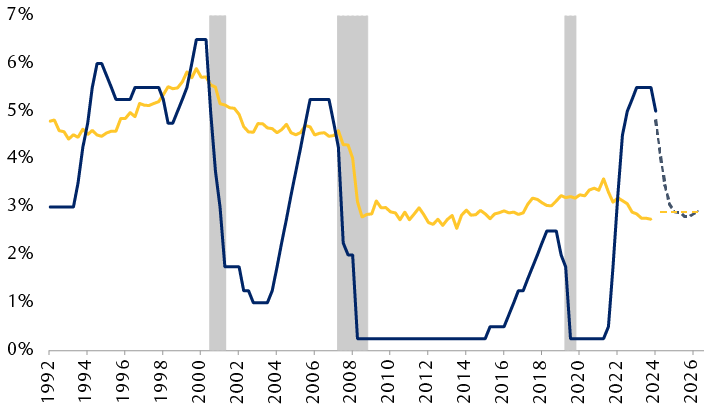
The line chart shows the Federal Reserve’s policy interest rate (the federal funds rate) relative to Fed estimates of the "neutral" interest rate for the economy from 1992 through September 2024, and projections through 2026. When the federal funds rate is above the neutral rate, policy is restricting economic growth and inflation; when the federal funds rate is below the neutral rate, interest rates are supporting economic growth. In December 2021, the Fed began raising the policy rate from 0.25% until it reached 5.5% in late 2023; it began to reduce the policy rate in June 2024. The federal funds rate rose past the neutral rate in September 2022 and remains significantly above it. Market pricing indicates the federal funds rate should fall back to the neutral rate in the first quarter of 2026.
Dashed lines indicate the market-implied path of the federal funds rate and the Federal Reserve’s estimate of the neutral interest rate (a policy rate above neutral is considered restrictive of economic growth; a rate below is considered supportive). Shaded areas indicate U.S. recessions.
Source - RBC Wealth Management, Federal Reserve Bank of New York, Bloomberg; data as of 9/24/24
With all eyes on the labor market, consumer sentiment toward it is still deteriorating and supports our view that the Fed will likely deliver at least one more 50 bps reduction this year. Eighteen percent of consumers surveyed reported that jobs were “hard to get” in the Conference Board’s monthly survey for September, which is up from just 11 percent at the start of the year. Over the past 30 years, this survey has had a 90 percent correlation with the official unemployment rate and suggests that further rises in unemployment could be in the offing.
And the bar to more rate cuts based on labor market conditions could be quite low. At the September policy meeting, the Fed’s 100 bps of projected rate cuts this year was predicated on the unemployment rate rising only moderately further to 4.4 percent, from 4.2 percent. Should it rise faster, the Fed would likely also cut rates faster still. With two more payrolls reports scheduled to be released before the next meeting on Nov. 6–7, that data will be key in determining what the Fed does next.
The main point is that we think the Fed needs to move quickly to return policy rates closer to “neutral” levels. The time to fine-tune and calibrate monetary policy more precisely around whatever level of interest rates that might be “neutral” for the economy will come later, in our view.
Consumers continue to flag a weakening U.S. labor market
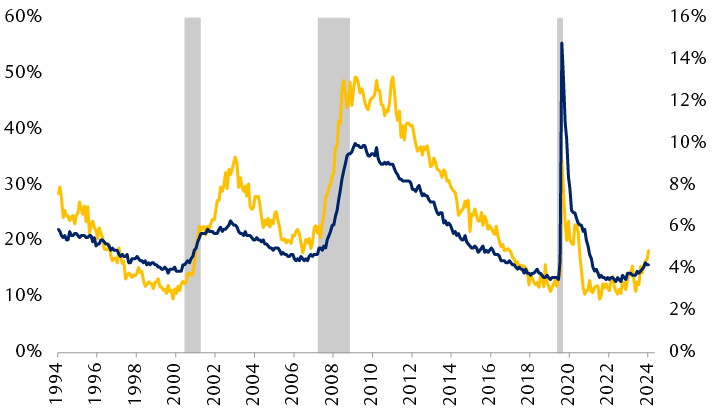
The line chart shows the Conference Board's Consumer Confidence Survey sub-index of the percentage of respondents who saw jobs as “hard to get,” and the U.S. unemployment rate. The two data series tend to move together. The percentage of respondents who viewed jobs as hard to get rose to 18.3% in September from 16.8% in August.
“Jobs hard to get” represents the percentage of respondents to the Conference Board’s monthly Consumer Confidence Survey expressing that view. Shaded areas indicate U.S. recessions.
Source - RBC Wealth Management, U.S. Bureau of Labor Statistics, Conference Board; data through September 2024
The price of success is steep, but not too steep
The yield curve is probably one of the most important, and reliable, market signals there is with respect to the economic outlook. Intuitively, it’s quite simple. The Fed controls short-term rates, while longer-term rates are largely influenced by market participants and generally reflect the market’s expectations for economic growth and inflation.
When the curve is inverted, as it had been up until recently, it’s the market’s signal that policy rates are likely restricting economic activity and inflation. When the opposite is true, the Fed’s policy rate is judged to be stimulative for growth and inflation.
For investors still wary about recessions risks, this may be the metric to watch. There’s no hard and fast rule—wouldn’t that be nice—but historically it appears to be the case that once the yield curve has re-steepened to >100 bps it has been closely followed by a recession. Intuitively, that gap grows because the 2-year Treasury yield is dropping sharply, and faster than long-term yields, on the market’s expectations that the Fed will be delivering deep rate cuts in response to an economic contraction.
But can the Fed find the middle ground? There’s really only one episode of the yield curve simply staying flat after a series of Fed rate cuts that were then held steady for a period of time, which came in the mid-to-late 1990s. Current consensus rate forecasts do indeed have the yield curve holding this “Goldilocks range”—a relatively steep yield curve that should signal modest support for the economy without reigniting inflation risks, but not so steep that the Fed is likely cutting rates because of a recession.
The end of an inversion
The 10Y/2Y Treasury yield curve’s return to positive territory after a period of deep inversion may have significant economic ramifications
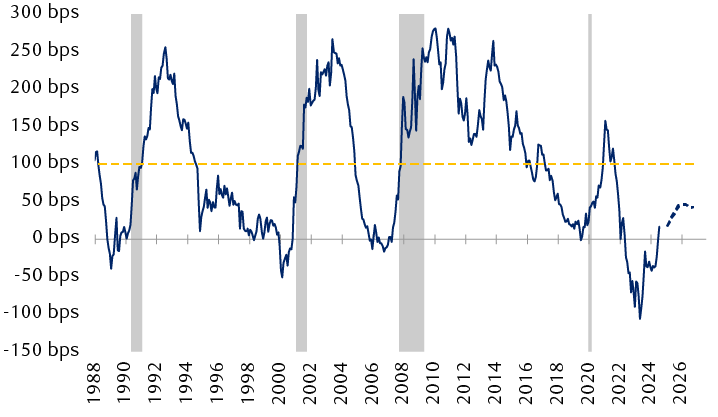
The line chart shows the difference in yields of 10-year and 2-year Treasury bond from 1988 through September 2024, and the consensus forecast through 2026. The difference became negative in mid-2022, a condition known as a yield curve inversion. It recently became positive again, and the consensus forecast indicates it will continue to move upward and remain positive through 2026.
Shaded areas indicate U.S. recessions.
Source - RBC Wealth Management, Bloomberg
Fixed income portfolio strategy
Policymakers may have just started cutting rates, but in the eyes of markets, it’s as though they’ve already finished.
As is usually the case, markets price the future. And as it stands, markets are fully priced for 200 bps of further rate cuts through 2025, which is already being largely reflected in bond prices and yields.
Most fixed income sectors have been on a strong run over the past year, gaining an even bigger head of steam back in April when the 10-year Treasury yield hit 4.7 percent, which has since faded as low as 3.6 percent. As yields fall, bond prices rise, and on top of coupons earned, this combination has fueled strong total return performance of late.
We have spent the past few months urging investors to exit cash and/or short-maturity bonds in favor of locking in yields via longer maturities ahead of Fed rate cuts.
The Bloomberg U.S. Aggregate Bond Index is up eight percent over the past year—or what is typically a strong year for the S&P 500 Index. High-yield corporate bonds are in the midst of one of their best runs on record—partly reflecting investor optimism that the Fed, at least for now, has staved off recession risks.
Unfortunately for fixed income investors, a lot of performance has already been squeezed out of bond markets, and to extract significantly more juice from them at the current juncture would likely require markets repricing greater risks of a hard landing for the U.S. economy—something that is not currently our view.
So, the playbook may not be much more exciting than “buying the dips” in bonds, or increases in yields, gradually extending duration in the process and keeping fixed income sector allocations relatively neutral, as there are few clearly attractive options available at the moment, in our view.
As credit markets remain historically rich, we would still favor quality. Even in a best-case scenario for the economy, we think sectors like investment-grade bonds will likely only keep pace with U.S. Treasury bonds in terms of performance, so we would likely favor the downside protection—and capital preservation—that Treasuries could provide for portfolios in the event of a recession.
Bonds have been on a strong run for the past 12 months
Market performance since the previous Fed rate hike (July 2023)
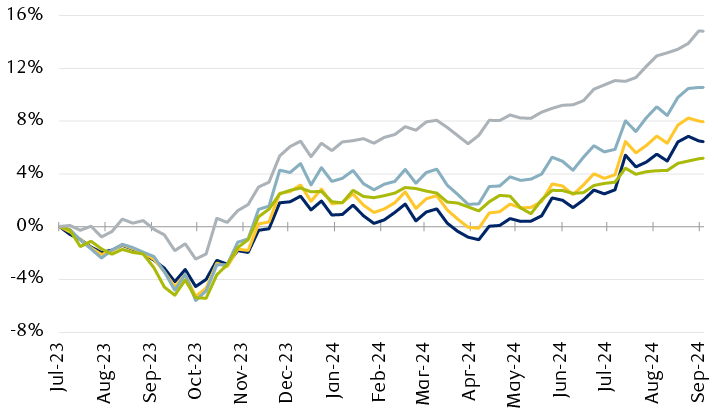
The chart shows the total returns for major U.S. fixed income markets since the Fed last raised rates in July 2023. All markets have trended generally upward. Treasuries have returned 6.4%. The U.S. Aggregate Index has returned 8.0%. Investment grade corporate bonds have returned 10.6%. Speculative grade corporate bonds have returned 14.8%. Municipal bonds have returned 5.2%.
Source - RBC Wealth Management, Bloomberg; Treasuries represented by the Bloomberg U.S. Treasury Index, corporates by the Bloomberg U.S. Corporate Bond Index and U.S. High Yield Corporate Bond Index, municipals by the Bloomberg Municipal Bond Index; data through 9/23/24
Consumer rate implications
Finally, what do the Fed’s rate cuts mean as a practical matter? As noted, Treasury yields have been dropping for months on investor anticipation of Fed rate cuts, so as we see it, much of what the Fed does from here is simply following through. Put differently, market rates have already priced in the bulk of future rate cuts, and consumer rates should gradually reflect that in the months ahead.
For example, 30-year mortgage rates are essentially priced off the 10-year Treasury yield. On April 25, both the 10-year Treasury yield and the average 30-year mortgage rate hit a 2024 high of 4.7 percent and 7.6 percent, respectively. Since then, each has declined by roughly 90 bps to 3.8 percent and 6.7 percent, respectively.
So, where might mortgage rates head from here? There are two things to consider: the 10-year Treasury yield itself, and the gap between it and 30year mortgage rates, which currently stands at roughly 300 bps.
The Bloomberg consensus analyst survey for September now has the 10year yield falling to 3.7 percent by early next year, and toward 3.6 percent by the end of 2025. Should spreads stay flat, that would suggest to us that mortgage rates might have already reached their near-term lows.
But what about spreads? At 300 bps over the 10-year Treasury yield, mortgage rates are historically expensive. Prior to the pandemic, that spread was closer to 150 bps–200 bps. The reasons are too numerous to cover here, but in short, we do see some scope for mortgage spreads to compress, particularly if the Fed ceases shrinking its balance sheet, as we see as likely later in 2025.
If lower yields and narrower mortgage spreads come together, we think the next stop for mortgage rates could be 6.0 percent, fading toward 5.0 percent later on. But lower rates than that might only come about in a recessionary episode.
Not quite there yet
The Fed hopes that a series of interest rate cuts will be enough to stave off a recession and support a continuation of the economic expansion. But it must be said, that’s always how central bankers hope that easing cycles play out—it’s just rarely the case that they do.
While we are encouraged by the Fed’s proactiveness and support the view that a soft landing remains on the table, we must be cognizant of the fact that after an aggressive rate hike cycle, and one which saw about 14 months between the last hike and the first cut, the balance of risks for the economy is naturally going to be tilted to the downside for some time yet.