With the S&P 500 marching higher since the spring tariff scare, the market’s valuation has risen nearly in tandem, pushing the price-to-earnings (P/E) ratio back up to a level that we view as pricey.
The S&P 500 has rallied 27.6 percent since the April 8 low and 8.1 percent year to date, as of yesterday’s close.
And since the April 8 low, the market’s 12-month forward P/E has jumped from 18.0x to 22.3x, almost a 24 percent increase. This valuation level is above the 18.6x 10-year average and is much higher than the 16.5x average since 1990.
It’s not just the Information Technology sector nor Magnificent 7 stocks that carry elevated valuations. Even when these two areas are excluded, valuations look high.
The market looks pricey even when some of the high P/E areas are excluded
S&P 500 12-month forward price-to-earnings ratios based on Bloomberg consensus earnings estimates
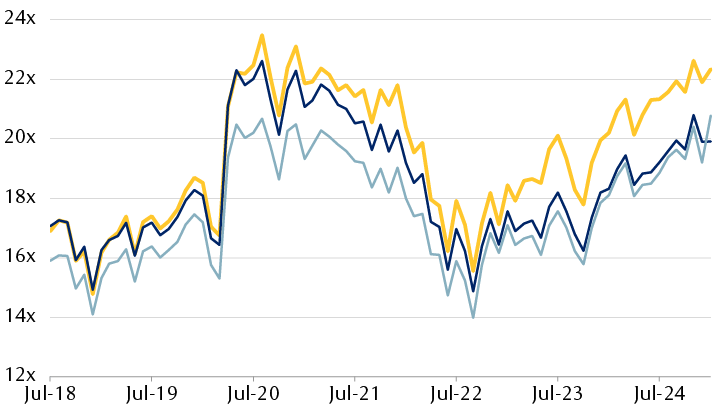
The line chart shows the forward price-to-earnings (P/E) ratio for the S&P 500, S&P 500 excluding the Information Technology sector, and S&P 500 excluding the Magnificent 7 stocks since July 2018. At the starting point, the valuations were as follows: S&P 500 16.89x, S&P 500 ex-Tech 17.1x, S&P 500 ex-Mag 7 15.9x. All three drifted up through late 2019. Soon thereafter they all rose sharply, peaking in mid-2020. Then all three traded lower through September 2022, bottoming in the 13.9x to 15.2x range, with the S&P 500 ex-Mag 7 the lowest and the S&P 500 the highest, and the S&P 500 ex-Tech in the middle of this range. Since then, they’ve all rebounded to high levels. The most recent data points from June 30, 2025 were as follows: S&P 500 22.5x, S&P 500 ex-Tech 20.4x, and S&P 500 ex-Mag 7 20.3x. Throughout much of this time, the S&P 500 valuation has been the highest.
*Magnificent 7 stocks are Microsoft, Apple, NVIDIA, Alphabet, Amazon.com, Meta Platforms, and Tesla.
Source - RBC Wealth Management, Bloomberg Intelligence; month-end data through 6/30/25 (S&P 500 18.0x P/E on April 8, 2025 is not shown in the monthly datastream)
Key drivers of P/E expansion
From our vantage point, there are logical, rational reasons why valuations have expanded:
Fears about the Trump administration’s tariff policies have diminished. Market participants seem to believe the worst of the tariff announcements are in the rearview mirror.
Domestic economic data has remained fairly sturdy. However, investors shouldn’t be complacent about this. RBC economists still anticipate tariffs will constrain economic growth and boost inflation during the second half of this year and into 2026, at least.
Equity market participants have embraced the One Big Beautiful Bill Act’s taxpayer-friendly and pro-business provisions. The stock market has largely ignored the bill’s negative impact on the federal deficit. We think these risks are showing up within the U.S. Treasury market, at the long end of the yield curve. The 30-year bond yield has been elevated near five percent for the past few months.
The corporate profits outlook—the mother’s milk of the stock market—is still viewed positively. The Q2 earnings reporting season has been fine-to-good so far, in our assessment. The S&P 500 2026 consensus earnings growth forecast of 12.6 percent has given the bulls something to lean on, although we still question whether this scenario will play out given the economic vulnerabilities.
The artificial intelligence (AI) buildout is a key factor. AI is now viewed by many market participants as a transformational technology—something at least akin to the advent of the personal computer and the development of the internet, or even potentially comparable to the industrial revolution and railway buildout over 100 years ago. Chinese academic Wang Wen, professor and dean at Renmin University in Beijing, goes further. He likens AI to one of the biggest changes in the past four centuries.
The AI transformation is advancing at its fastest pace—by far—in the U.S. and China. So it should be no surprise that the U.S. market is benefitting from having relatively high exposure to the emerging technology.
AI is not just impacting valuations of technology firms that have been at its epicenter for the past few years. Some companies in the Industrials, Financials, and Utilities sectors have seen their stock valuations expand in the past year partly due to their potential ability to leverage AI to cut costs and/or improve their goods and services. It’s reasonable to think stocks in other sectors could benefit from AI in the future.
A poor market-timing tool
For individual investors, the market’s valuation—whether expensive, inexpensive, or something in between—has historically been a poor market-timing barometer.
P/E ratios and other valuation metrics can stay elevated for longer than one might think is reasonable, like they did during the technology bubble more than 25 years ago. Conversely, they can fluctuate near low levels for long periods, as was the case for years after the tech bubble burst and especially following the global financial crisis.
We think it’s unwise to make buy or sell decisions solely or even mainly based on valuations. Instead, we recommend using valuations as one of many factors that can help determine how much (or little) equity exposure is suitable in a portfolio at any given time.
Diversification becomes more relevant
Even though there have been valid reasons for the recent valuation expansion, and we’re mindful valuations could remain elevated throughout the duration of this bull market cycle like they have at times in the past, the current P/E ratio gives us pause. It’s one reason we continue to recommend holding U.S. equity exposure at no higher than a Market Weight level in portfolios.
There are two additional reasons that make us reluctant to chase the market and position more aggressively: Potential economic vulnerabilities due to tariffs and the possibility that second-half 2025 and full-year 2026 earnings results could fall short of current consensus forecasts.
Among the S&P 500 sectors that are reasonably priced compared to their 10-year averages, we favor Real Estate and Health Care. At the other end of the spectrum, in the “pricier” category, we still like Information Technology but would not be adding exposure at current levels.
Some sectors seem rather overvalued while others do not
Price-to-earnings ratios based on 12-month forward Bloomberg consensus earnings estimates
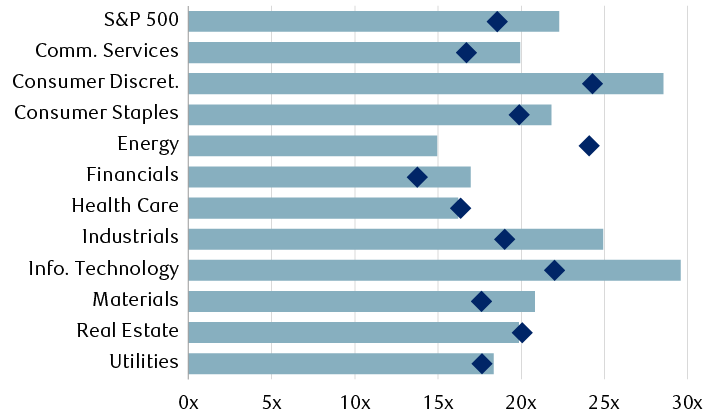
The chart shows data for the current price-to-earnings (P/E) ratios and 10-year average P/Es for the S&P 500 and each of the 11 sectors within it. The data are as follows, in that order (current, 10-year average). S&P 500: 22.3x, 18.6x. Communication Services: 19.9x, 16.7x. Consumer Discretionary: 28.5x, 24.3x. Consumer Staples: 21.8x, 19.9x. Energy: 14.9x, 24.1x. Financials: 17.0x, 13.8x. Health Care: 16.2x, 16.4x. Industrials: 24.9x 19.0x. Information Technology: 29.6x, 22.0x. Materials: 20.8x, 17.6x. Real Estate: 19.9x, 20.1x. Utilities: 18.3x, 17.6x.
Source - RBC Wealth Management, Bloomberg; data as of 7/23/25
The S&P 500’s stretched valuation is also an argument for diversification into markets outside of the United States.
Valuations of European and Asian developed markets and Asian emerging markets are near or slightly below their 10-year averages. We think investors who have traditionally held high levels of U.S. equities exposure in portfolios should make some room for investments in these markets as well.